
FIGURE 1.
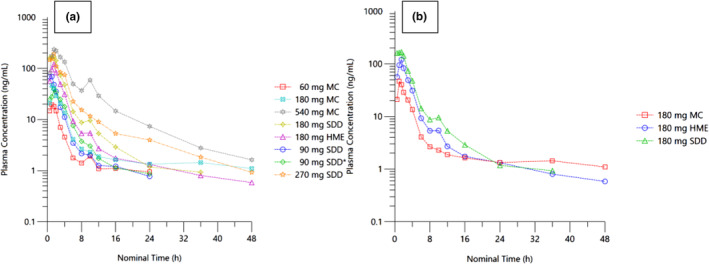
(a) Plasma concentration profiles of TQS‐168 following single‐dose administration of different dose levels of TQS‐168 with different formulations (* denotes fed state). (b) Plasma concentration profiles of TQS‐168 following single‐dose administration of 180 mg MC, SDD, and HME suspensions under fasted state. HME, hot‐melt extrusion; MC, methylcellulose; SDD, spray‐dried dispersion.