
FIGURE 2.
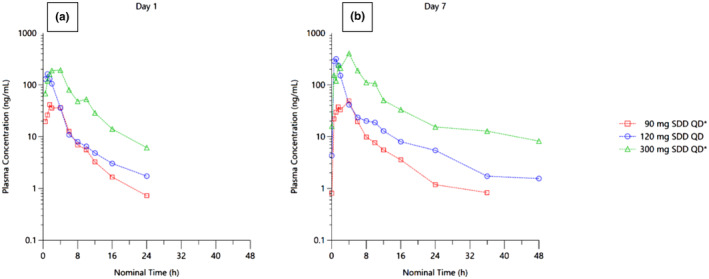
Plasma concentration profiles of TQS‐168 following (a) single (Day 1) and (b) repeated (Day 7) oral administration of TQS‐168 SDD formulation (* denotes fed state).
Official websites use .gov
A
.gov website belongs to an official
government organization in the United States.
Secure .gov websites use HTTPS
A lock (
) or https:// means you've safely
connected to the .gov website. Share sensitive
information only on official, secure websites.
Plasma concentration profiles of TQS‐168 following (a) single (Day 1) and (b) repeated (Day 7) oral administration of TQS‐168 SDD formulation (* denotes fed state).