FIGURE 3.

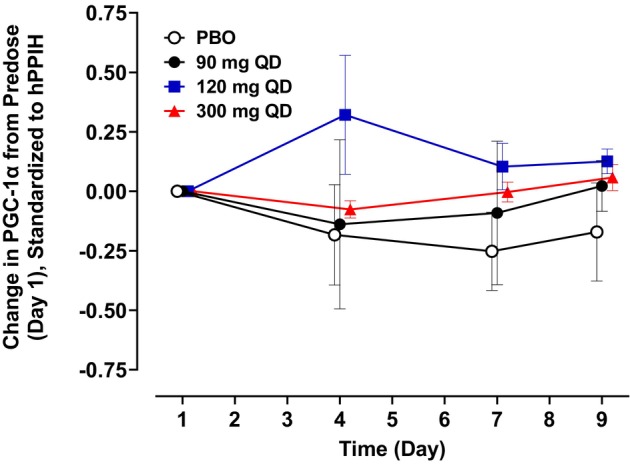
Change in PGC‐1α expression after treatment with multiple doses of TQS‐168. Values are arithmetic mean ± SEM. Times offset slightly on x axis for clarity.

Change in PGC‐1α expression after treatment with multiple doses of TQS‐168. Values are arithmetic mean ± SEM. Times offset slightly on x axis for clarity.