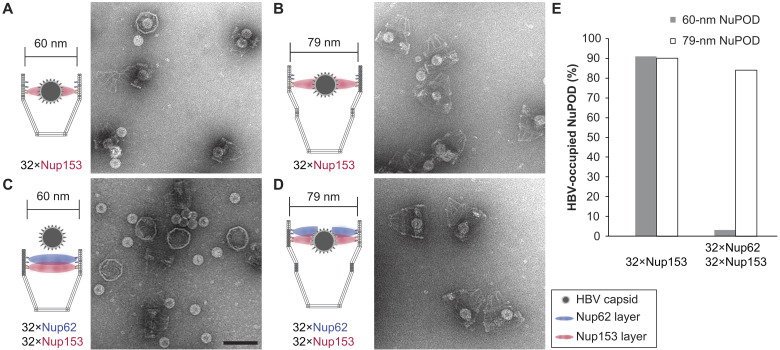
Fig. 4. HBV capsid interactions with NuPODs of different widths.
(A) HBV capsids mixed with capped 60-nm Nup153 NuPODs. (B) HBV capsids mixed with capped 79-nm Nup153 NuPODs. (C) HBV capsids mixed with capped 60-nm Nup62-Nup153 NuPODs. (D) HBV capsids mixed with capped 79-nm Nup62-Nup153 NuPODs. For (A) to (D), schematic diagrams of the binding experiments are shown next to representative TEM images. Scale bar, 100 nm. (E) Percentages of NuPODs occupied by HBV capsids in experiments (A) to (D). The experiments were repeated two to three times (technical replicates) with similar results. NuPODs counted in each experiment are (from left to right) 168, 247, 279, and 215.

