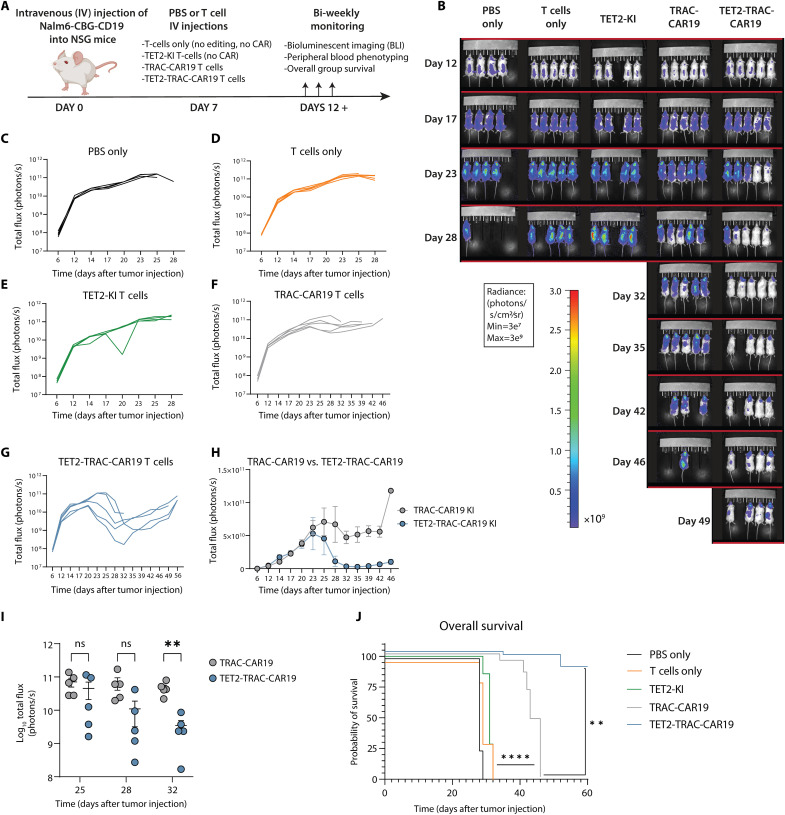
Fig. 7. TET2 KI enhances the antitumor activity of TRAC-CAR19 T cells in vivo.
(A) Overview of in vivo experimental design, n = 4 to 5 mice per experimental group; one experiment. (B) Longitudinal tumor burden of all experimental groups by bioluminescent imaging (BLI). (C to G) Tumor outgrowth for PBS only (C), T cell (D), TET2-KI T cell (E), TRAC-CAR19 T cell (F), and TET2-TRAC-CAR19 T cell (G) groups, with individual mice shown. (H) Longitudinal comparison of TRAC-CAR19 and TET2-TRAC-CAR19 T cell group tumor burden. (I) BLI comparison at days during and immediately after peak CAR T cell response in TRAC-CAR19 and TET2-TRAC-CAR19 groups, line at mean with SEM; ns P > 0.05; *P < 0.05; **P < 0.01 by multiple paired t tests with Holm-Šídák correction. (J) Overall group survival, **P < 0.01; ****P < 0.0001 by Mantel-Cox log-rank test. Data shown as means ± SEM (H) or individual values [(C) to (G) and I)] from each mouse. Schematic (A) created with BioRender.com.

