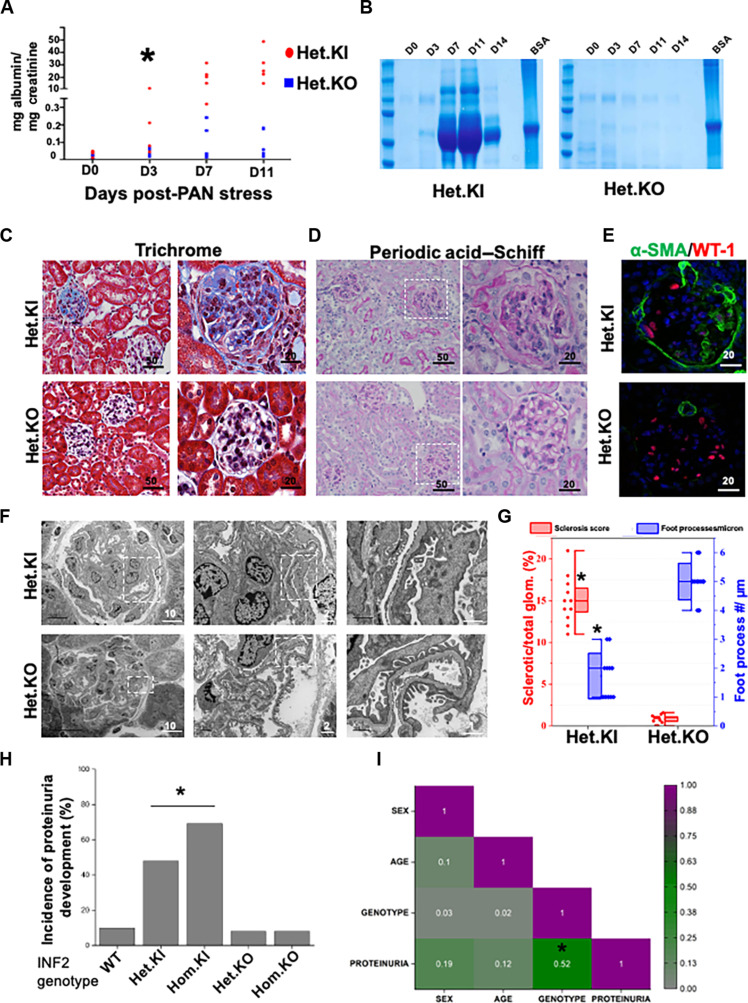
Fig. 1. INF2 R218Q knock-in mutant and INF2 knockout mouse models differ in disease development.
[(A) to (G)] Heterozygous INF2 R218Q knock-in and heterozygous INF2 knockout mouse models were stressed with puromycin aminonucleoside (PAN) and assessed for development of kidney disease. (A) Quantification of urinary albumin to creatinine ratio. Statistical significant differences were seen between knock-in versus knockout mice from day 3 (*P < 0.01; Student’s t test). (B) Urine-gel electrophoresis. Urine samples from different time points of a representative PAN-stressed heterozygous knock-in and heterozygous knockout mouse underwent electrophoresis in an SDS-PAGE gel. [(C) and (D)] Histology analysis. PAN-stressed mice were examined after eight weeks for histological changes. (C) Trichrome staining and (D) periodic acid–Schiff staining. Fibrotic lesions were noted in heterozygous knock-in but not in heterozygous knockout mice. Higher magnification images of the highlighted regions are shown in series. (E) Immunofluorescence analysis of WT-1 (podocyte marker) and α–smooth muscle actin (α-SMA; fibrosis marker). Increased smooth muscle actin expression was noted in PAN-stressed heterozygous knock-in mice but not in heterozygous knockout mice. (F) Ultrastructural analysis of podocytes. Higher magnification images of highlighted regions were shown in series. (G) Quantification of sclerosis and foot processes effacement (*P < 0.01; Student’s t test). (H) Disease development among various INF2 genotypes. Mice from all INF2 genotypes were PAN stressed and evaluated for proteinuria development. Incidence of proteinuria incidences was significantly higher in heterozygous and homozygous knock-in genotype mice (*P < 0.01; one-way ANOVA). (I) Correlogram representing the Pearson correlation coefficient matrix between various mice features. Colors indicate the values of the correlation coefficient, as indicated in the scale bar. A significant correlation was present between genotype and proteinuria but not with other mice features (*P < 0.05; r = 0.52). All scale bars are in micrometers.

