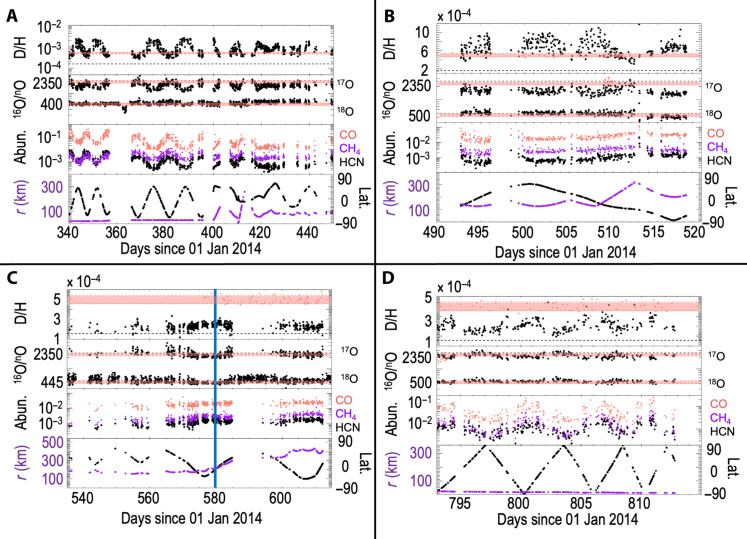
Fig. 3. Observations of how the isotope ratios and abundances of hypervolatile species correlate with either latitude or distance at different time periods of the mission because of dust influencing the local coma composition.
The isotope ratios are compared to published values (salmon dots and shaded regions) in the top three panels. (A) Pre-perihelion at a distance of 2.1 to 2.9 AU from the Sun. (B) Pre-perihelion at a distance of 1.8 to 2.0 AU from the Sun. (C) Around perihelion (blue line) at 1.2 AU from the Sun. (D) Post-perihelion at 2.5 AU from the Sun (see the Supplementary Materials and table S6).

