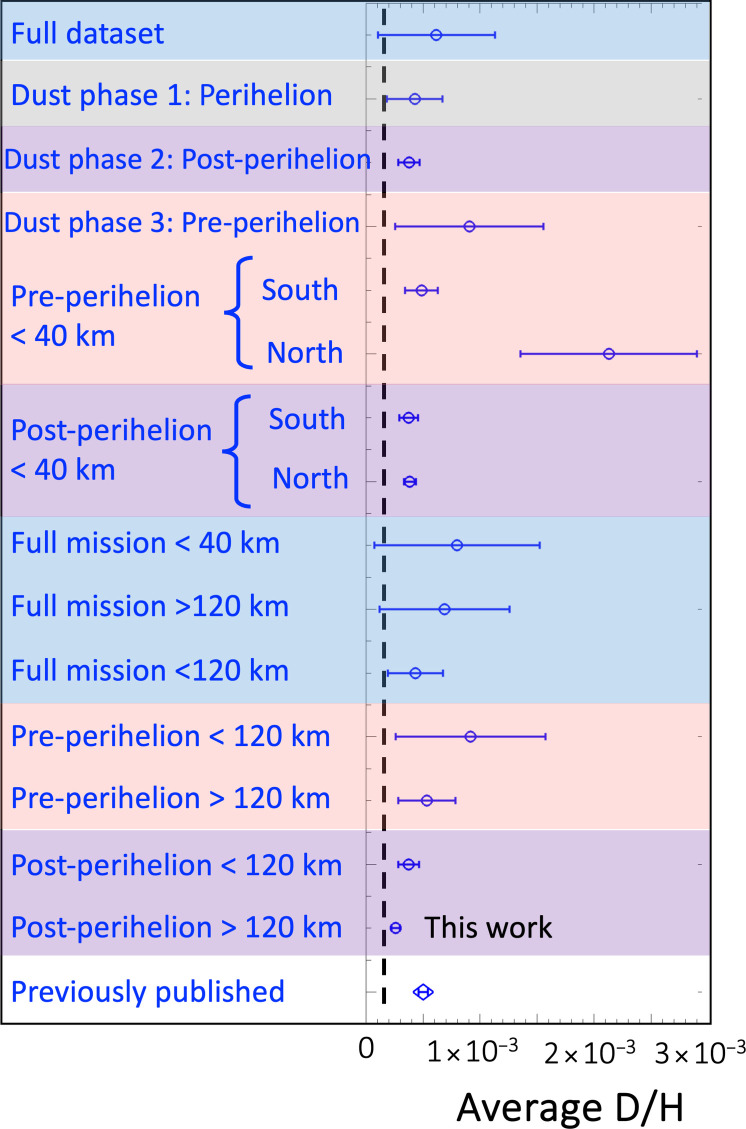
Fig. 4. Average and standard deviation for D/H measured during different time periods of the mission along with our final derived value compared to previous work.
Colors represent the phases of the dust cycle described earlier. Phase 1 is perihelion (gray), phase 2 is post-perihelion (purple), and phase 3 is pre-perihelion (salmon). Error bars indicate how much the D/H varies within each group (see Materials and Methods and table S7) and the dashed line corresponds to the VSMOW value.

