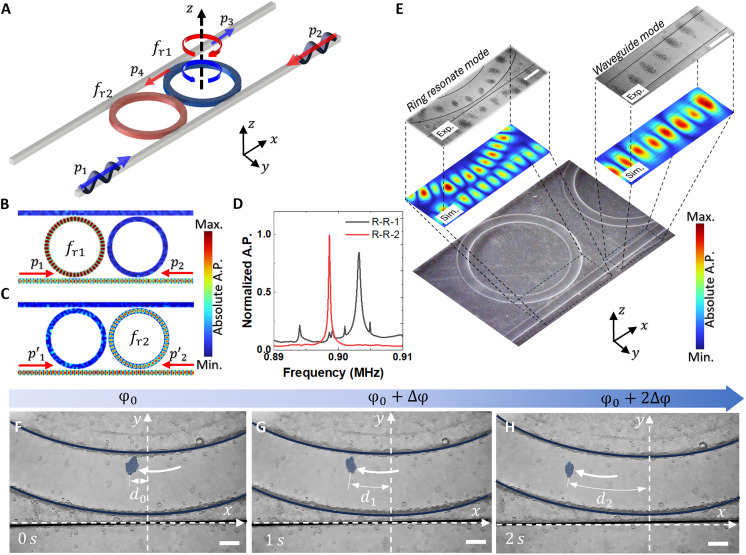
Fig. 2. Particle trapping via acoustofluidic RR tweezers.
(A) Bottom schematic diagram shows the simulation and the experimental setup to create the standing acoustic wave inside of the RR and waveguide by two directly opposite input signals p1 and p2. The signal will be pumping with signals p3 and p4. (B and C) Simulation results show the standing wave in the RR and waveguide created by two directly opposing input signals p1 and p2 with frequency fr1 and fr2 for the first and second ring, respectively. (D) Blue and red lines show the normalized acoustic pressure inside of the first and second ring, respectively. (E) Simulation illustrates the acoustic field within the waveguide and RR, resulting from the acoustic radiation force within the standing wave field. This force leads to the trapping of particles within the ring, where they remain positioned at locations of maximal signal strength. From (F) to (H), the phase for the signal p1 will be varied from p1(φ0) to p1(φ0 + 2∆φ) with step ∆φ, thus the particles inside of the RR will also move within its guideway. Scale bars, 300 μm.

