FIGURE 2.

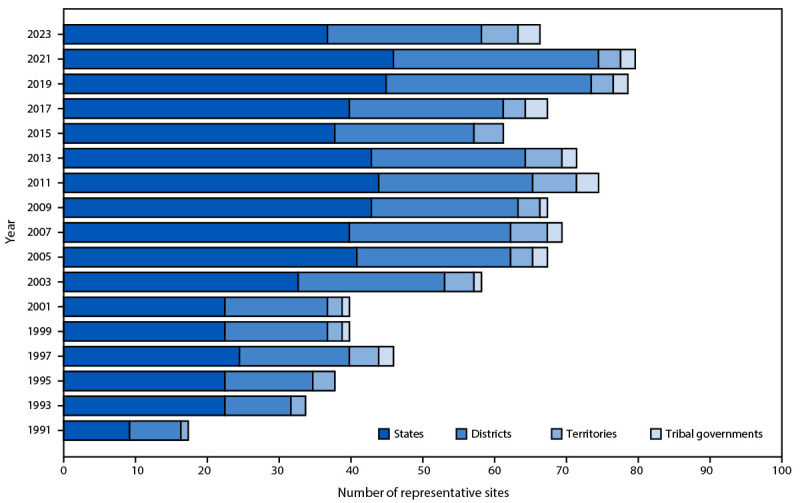
Number of states, local school districts, territories, and tribal governments with representative Youth Risk Behavior Survey data, by year of survey — selected U.S. sites, Youth Risk Behavior Survey, 1991–2023

Number of states, local school districts, territories, and tribal governments with representative Youth Risk Behavior Survey data, by year of survey — selected U.S. sites, Youth Risk Behavior Survey, 1991–2023