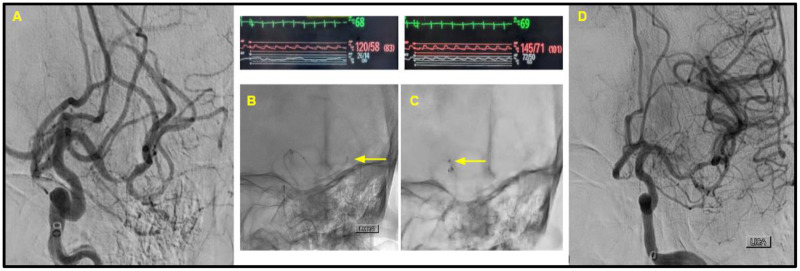
Figure 1.
Patient 1. (A) The initial selective digital subtraction angiogram from the left internal carotid artery, noting the left M1 near-complete occlusion and decreased opacification of the M2 branch. (B and C) The position of the Rebar18 microcatheter (with yellow arrow pointing to the distal tip). Immediately above these images is noted the heart rate (green), blood pressure from radial artery line (red), and manometry waveforms from the Rebar18 microcatheter (white). Trans-clot manometry shows a MAP of 20 mmHg distal to the clot, in comparison to the MAP of 60 mmHg proximal to the clot. (D) The successful first-pass recanalization with TICI score of 3.

