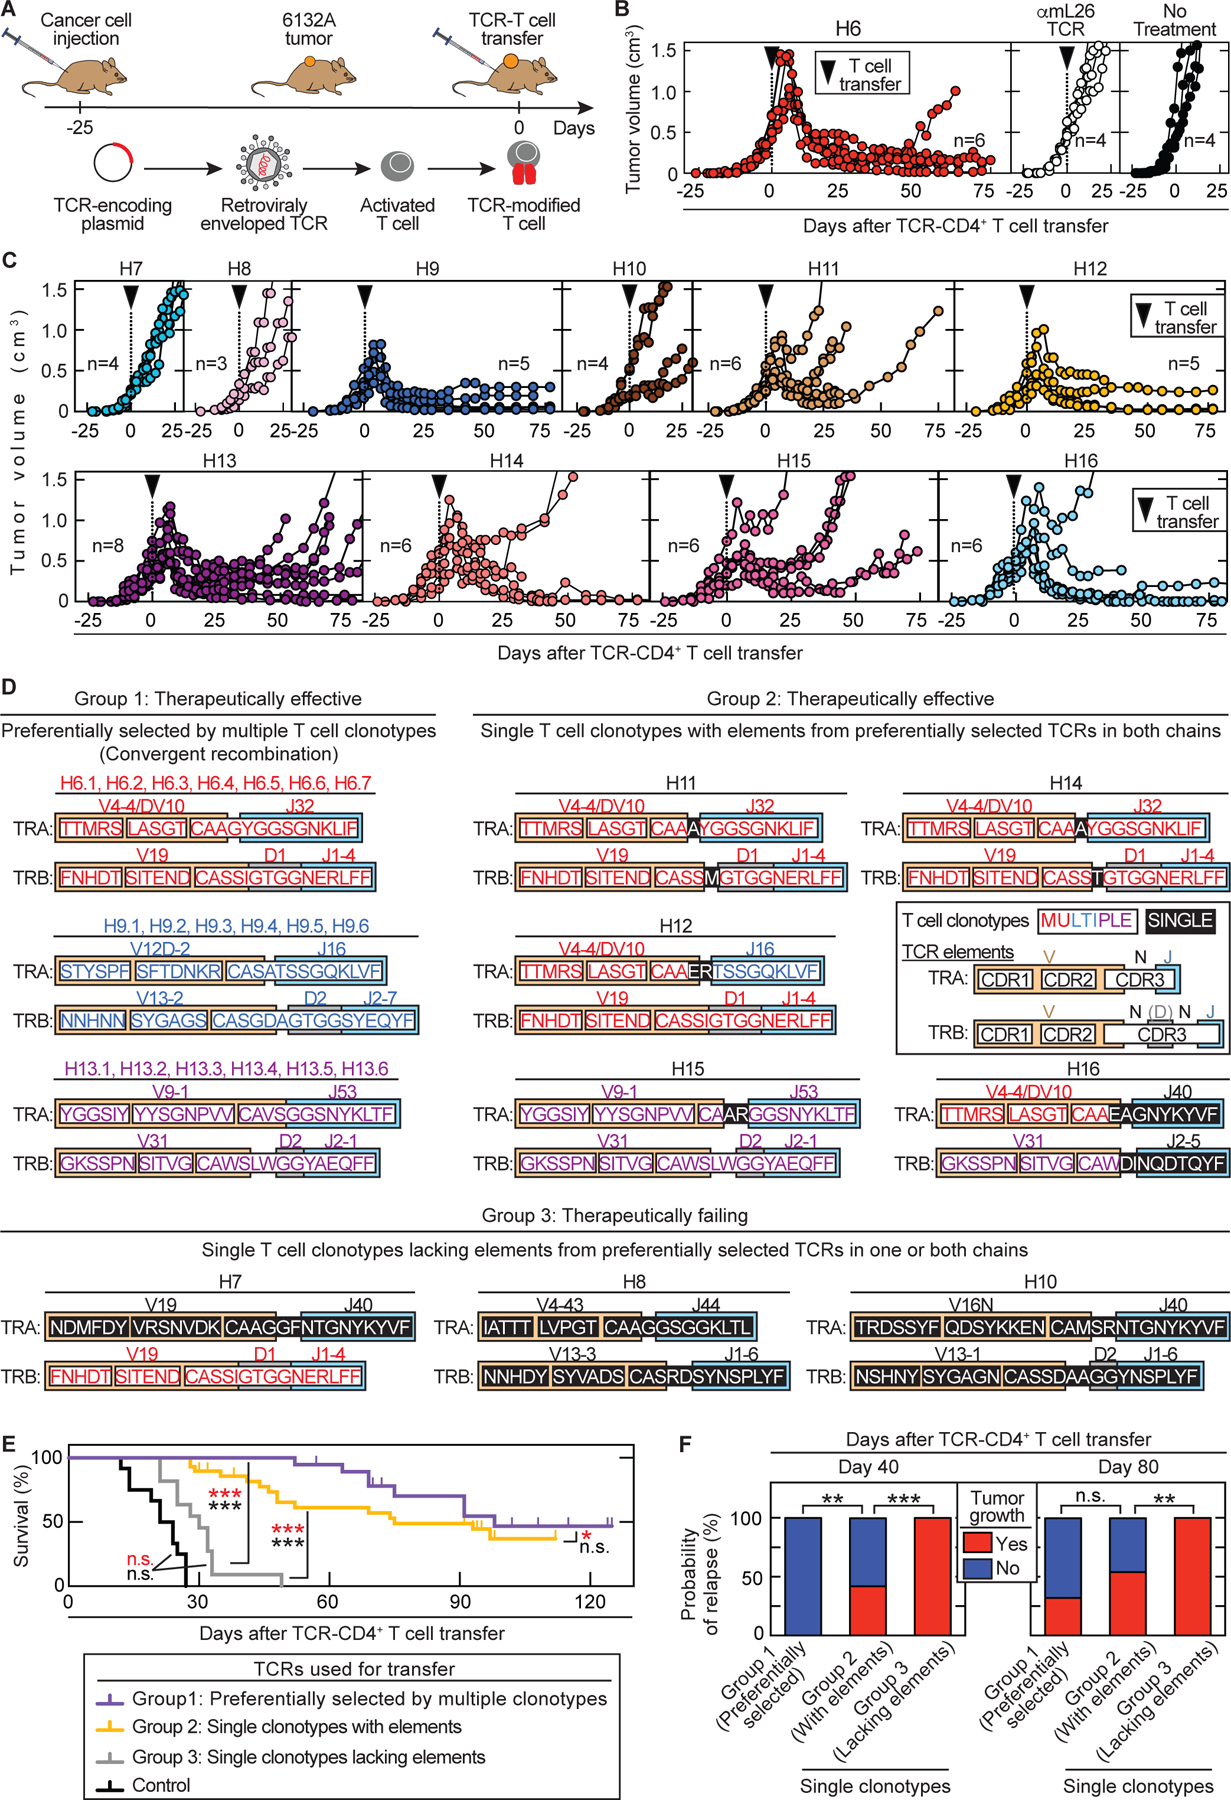
Fig. 2. Therapeutically effective TCRs cause tumor destruction followed by long-term growth arrest and can be predicted by CDR elements of preferentially selected TCRs.

(A) Outline of adoptive transfer using TCR-engineered T cells. (B – C) Spleens from C3H CD8-/- mice were used as CD4+ T cell source for TCR engineering. C3H Rag-/- mice bearing 6132A tumors were treated with TCR-engineered CD4+ T cells 21 to 25 days after cancer cell injection as indicated by the arrow head. Total number of mice (n) is indicated. (B) Average tumor sizes were 0.558 cm3 ± 0.122 cm³ standard deviation at day of treatment. Data are summarized from three independent experiments. (left) Treatment was performed with H6-T cells (n = 6). (middle) Mice treated with αmL26-T cells, which are specific against an irrelevant antigen (n = 4) have the same outcome as (right) untreated mice (n = 4). (C) Average tumor sizes were 0.378 cm3 ± 0.156 cm³ standard deviation at day of treatment. Data are summarized from two independent experiments. Treatment with different TCR-engineered CD4+ T cells is indicated from left to right, top to bottom: H7 (n = 4), H8 (n = 3), H9 (n = 5), H10 (n = 4), H11 (n = 6), H12 (n = 5), H13 (n = 8), H14 (n = 6), H15 (n = 6) and H16 (n = 6). (D) The 11 TCRs fell into three groups based on therapeutic failure or efficacy (defined by >25% shrinkage of tumor volume) and whether being generated by multiple or single clonotypes. Color coding indicates whether CDR elements were shared in TRA and/or TRB with preferentially selected TCRs. (E – F) TCR-treatment Group 1: H6, H9, H13 (total n = 16). Group 2: H11, H12, H14, H15, H16 (total n = 29). Group 3: H7, H8 and H10 (total n = 11). (E) The three groups were compared in a survival analysis (*p ≤ 0.5, ***p ≤ 0.001 significance, n.s. – not significant). Log-rank test was used to determine significance indicated in black while significance indicated in red used the Wilcoxon test. (F) Probability of relapse at day 40 or 80 after start of T cell transfer among the three TCR-treatment groups. **p ≤ 0.01 and ***p ≤ 0.001 significance determined using a two-tailed Fischer’s exact test (n.s. – not significant).
