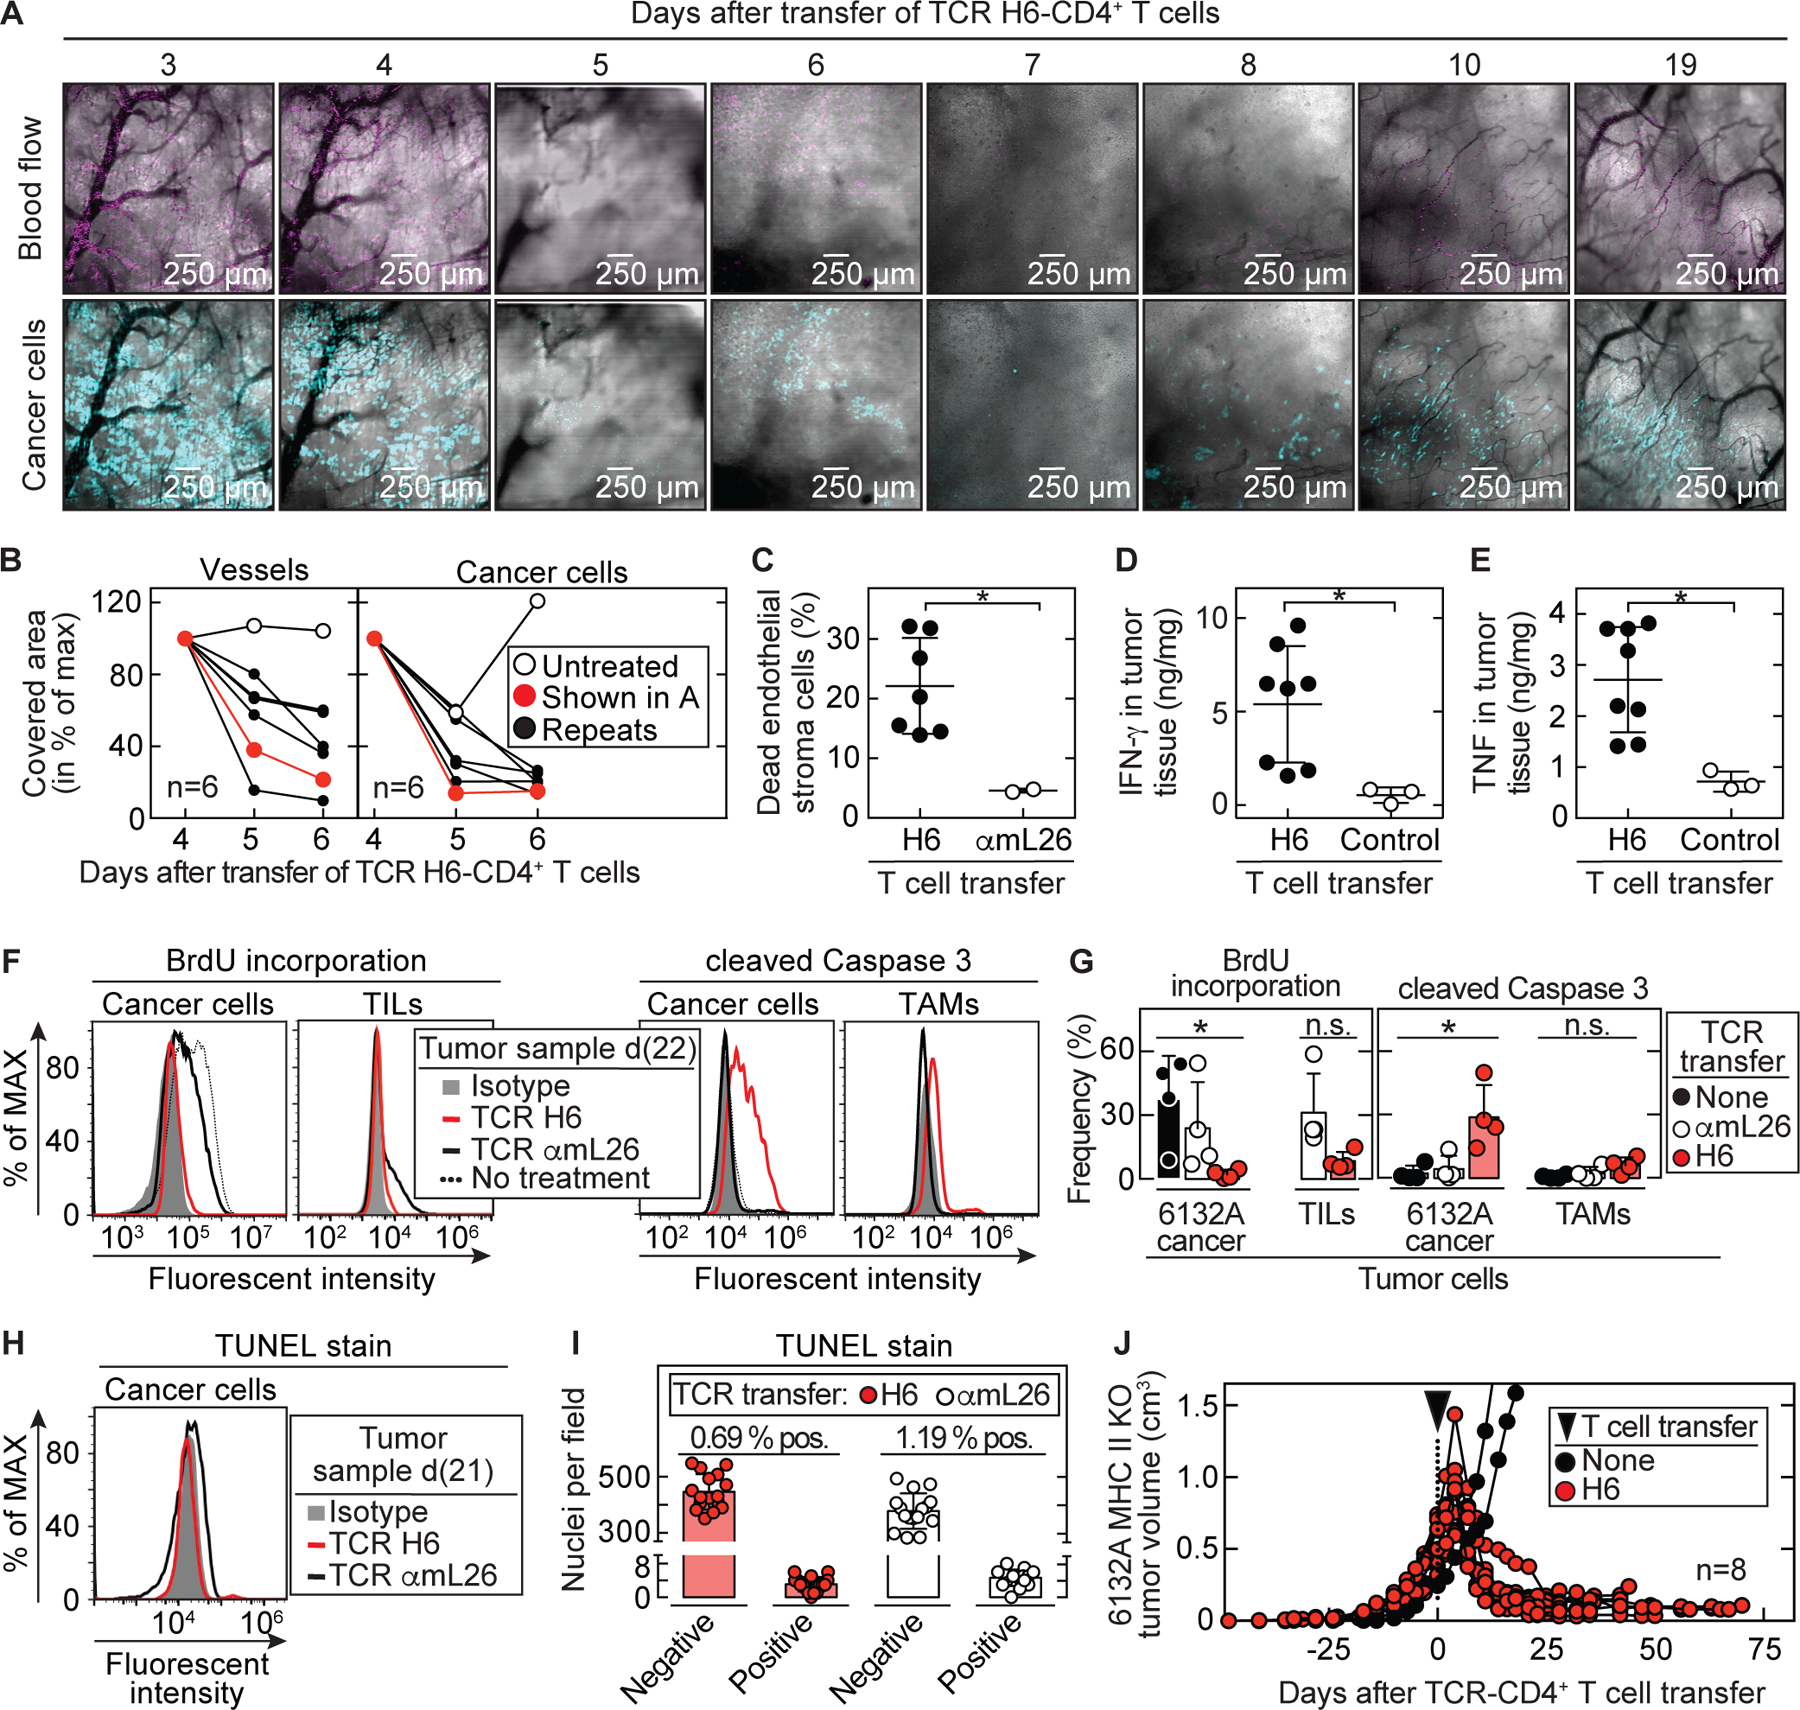
Fig. 3. Stroma recognition by CD4+ T cells is sufficient to cause tumor destruction followed by growth arrest.

(A) Example of longitudinal microscopy in 6132A-cerulean tumor bearing C3H Rag-/- mice after transfer of H6-T cells. Tumor areas were randomly chosen before therapy and analyzed for (B) vessel and cancer cell reduction (total n = 6). DiD-labeled erythrocytes were used to visualize blood flow. Imaged area (in pixels) that was covered by vessels (black) or cancer cells (blue) from day 4 was set to 100%. Following days were assigned as percentage of maximum covered area. Indicated are an untreated control mouse (open circle) and the H6-treated mouse (red) shown in (A). Histology of tumor and vessel destruction on day 6 are shown in Fig. S7. (C – E) Tumor tissue was analyzed on day 6, 7 and 8 after therapy by flow cytometry. Control tumors received either no T cells (total n = 1) or αmL26-T cells (total n = 2) and were analyzed at day 8. Results are means ± SD from two independent experiments. Significance between groups was determined by a two-tailed Student’s t-test with *p ≤ 0.05. (C) Tumors were analyzed for dead endothelial cells (Sytox-positive, CD146 and CD31 double-positive cell populations) (total n = 7). (D) IFN-γ and (E) TNF concentrations in tumor tissue were determined (total n = 8). (F – I) 6132A-ECFP was used for injection into C3H Rag-/- mice. (F – G) Tumors were left untreated (total n = 4) or treated with either H6- (total n = 4) or αmL26-T cells (total n = 4). Mice were injected with BrdU twice a day for three consecutive days before tumor tissue was isolated at day 20 – 25 after T cell transfer. (F) A representative flow cytometry analysis is shown. (left) 6132A-ECFP cancer cells and TILs (CD3+, CD4+ and mL9-tetramer+) were analyzed by flow cytometry for frequency of BrdU incorporation. (right) 6132A-ECFP cancer cells and TAMs (CD11b+, F4/80+) were analyzed by flow cytometry for activation of cleaved caspase 3. (G) Significance between groups of 6132A cancer cells was determined by an ordinary one-way ANOVA with *p ≤ 0.05 (n.s. – not significant). Results are compiled from three independent experiments. (H – I) Tumors were treated either with H6- or αmL26-T cells. Tumor tissue was isolated at day 20 – 22 after T cell transfer (H) Life 6132A-ECFP cancer cells were analyzed by TUNEL-stain using flow cytometry. One representative flow cytometry analysis is shown out of two independent experiments. (I) DNA damage on formalin-fixed paraffin-embedded 6132A tumor slides was determined using TUNEL stain by immunohistochemistry. Eight fields were counted per slide. Shown is the total number of nuclei that were either stained negative or positive for TUNEL. The proportion (%) of TUNEL positive nuclei was slightly higher (p = 0.0017) in αmL26-treated control samples (1.19 ± 0.45 %) compared to H6-treated samples (0.69 ± 0.39 %). (J) C3H Rag-/- mice bearing 6132A MHC II KO tumors (red, total n = 8) were treated with H6-T cells 31 to 35 days after cancer cell injection, indicated by the arrow head. Spleens from C3H CD8-/- mice were used as CD4+ T cell source for TCR-engineering. Average tumor sizes were 0.530 cm3 ± 0.170 cm³ standard deviation at day of treatment. Data are summarized from two independent experiments. Shown are untreated tumors (black, total n = 2) as control.
