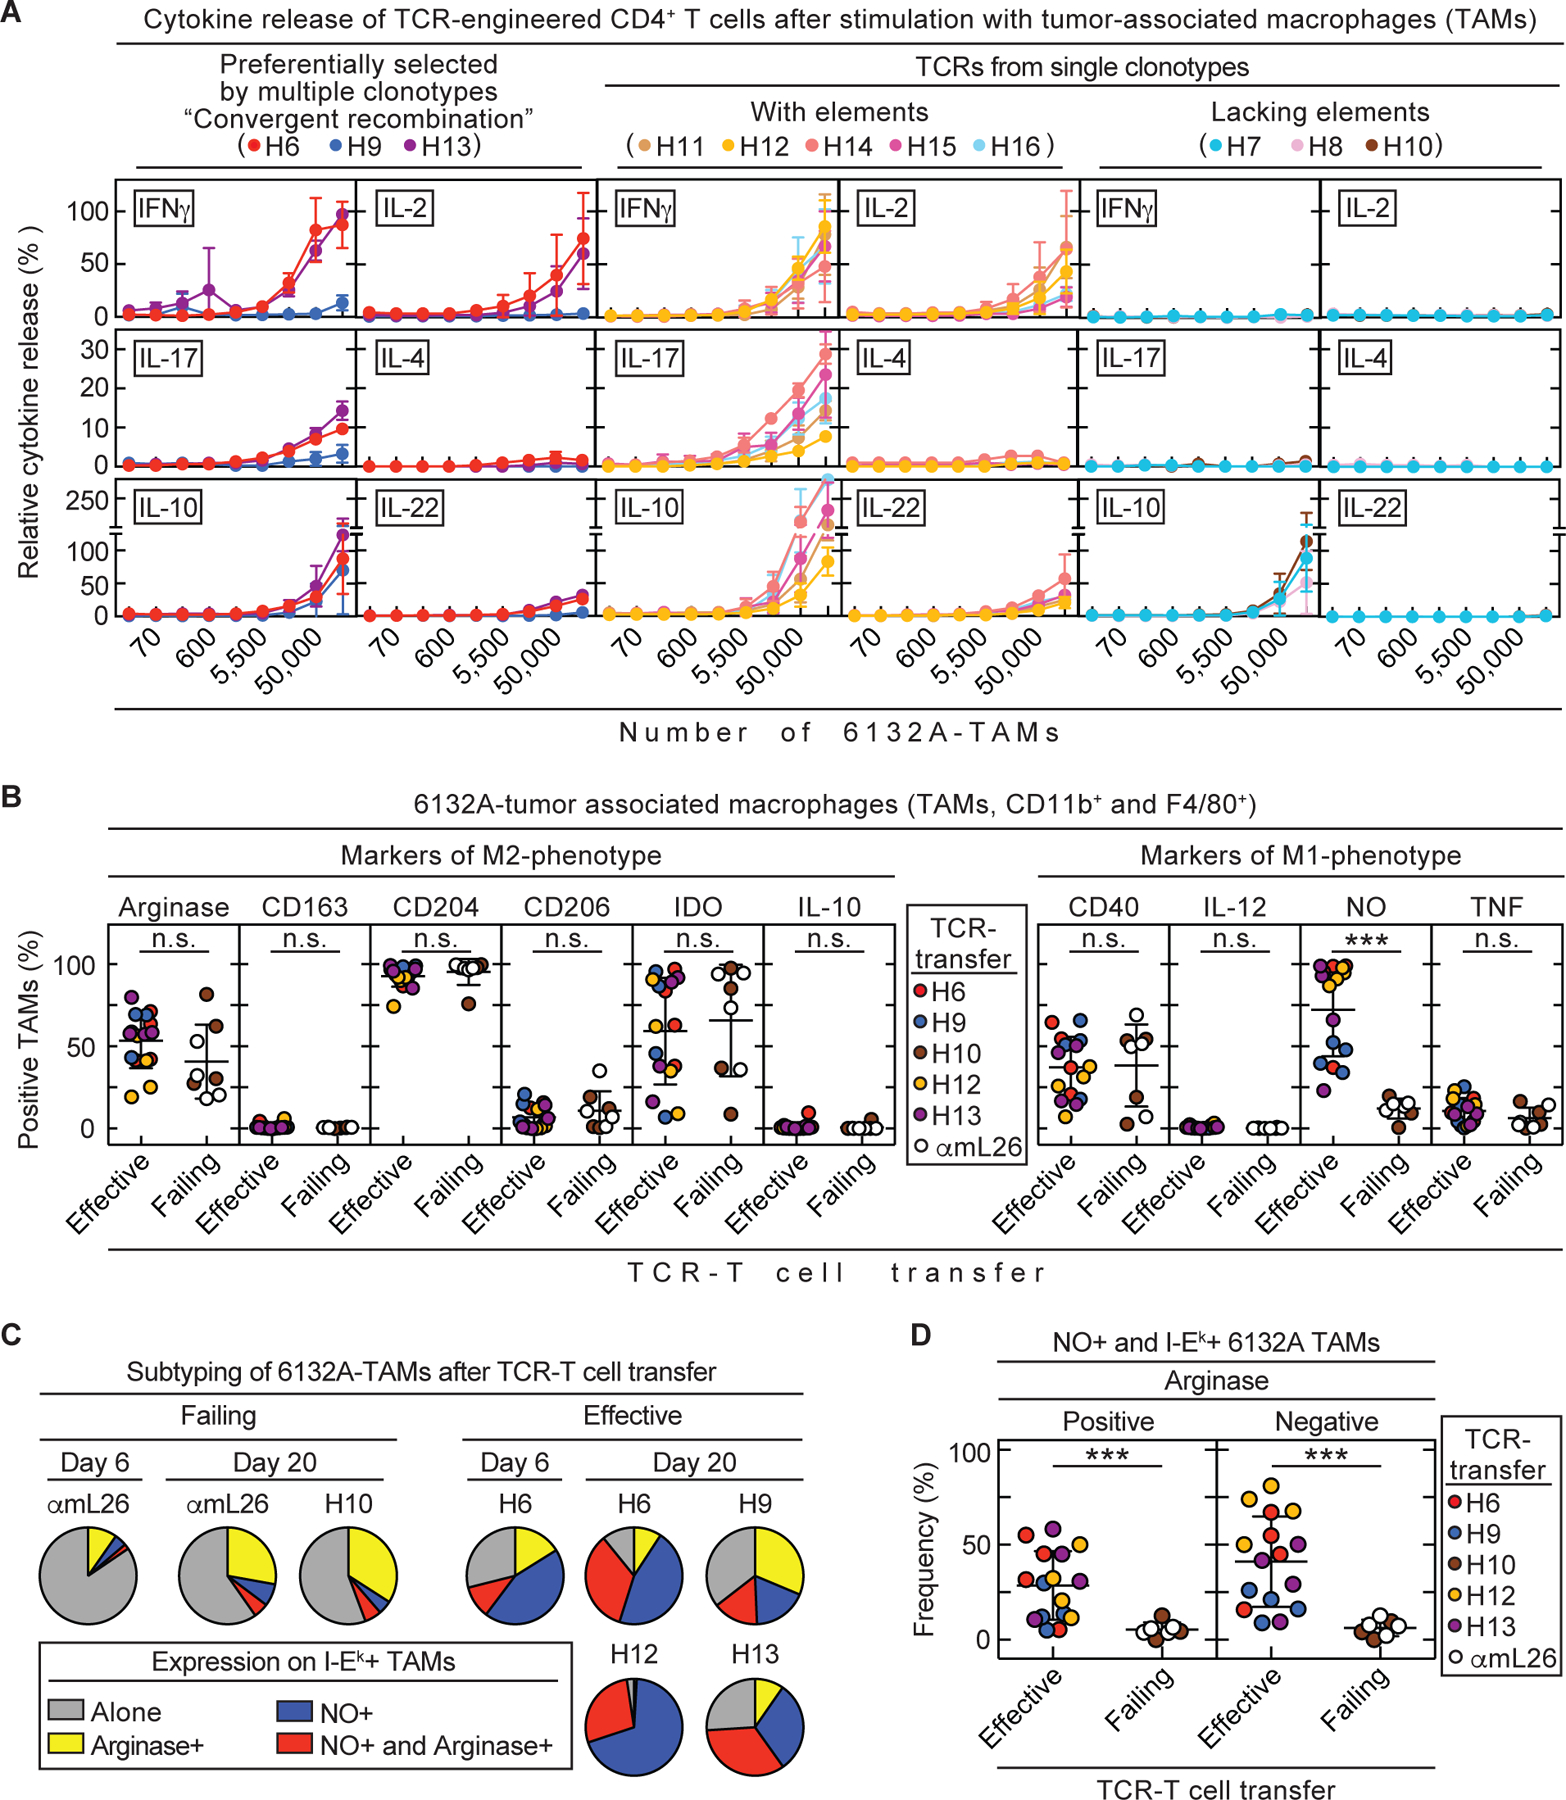
Fig. 5. NO expression in 6132A tumor-associated macrophages is induced by T cells when transduced with therapeutically effective CD4TCRs.

(A – D) Spleens from C3H CD8-/- mice were used as CD4+ T cell source for TCR-engineering. (A) TCR-engineered CD4+ T cells were co-cultured 24 h with 3-fold dilutions of tumor-associated macrophages (F4/80+ cells) isolated from 6132A tumors grown in C3H Rag-/- mice. Supernatants were analyzed for various cytokines by flow cytometry. Data are means ± standard deviation and compiled from two independent experiments. (B – D) C3H Rag-/- mice bearing 6132A tumors were treated with either H6- (n = 4), H9- (n = 4), H10- (n = 4), H12- (n = 4), H13- (n = 4) or αmL26- (n = 4) TCR-engineered T cells 21 to 23 days after cancer cell injection. Tumor tissue was isolated at day 20 – 22 after T cell transfer. Tumors were analyzed by flow cytometry for frequency of life CD11b+ and F4/80+ 6132A tumor-associated macrophages (TAMs) expressing M1-type (CD40, IL-12, NO and TNF) or M2-type (arginase, CD163, CD204, CD206, IDO and IL-10) markers. TCR-Treatment was divided into effective (H6, H9, H12 and H13, n = 16) and failing (H10 and αmL26, n = 8) therapy groups. Therapeutically effective TCRs are able to induce tumor shrinkage by more than >25% volume within 12 days after T cell transfer. All other TCRs are considered therapeutically failing which also includes the control TCR αmL26. Number (n) indicates the total number of tumors analyzed from independent mice. (B) Comparison of M1- and M2-type markers of TAMs from effective or failing TCR-T cell therapy. Significance between groups was determined by an unpaired, two-tailed Student’s t-test with ***p ≤ 0.001 (n.s. – not significant). Data are compiled from two independent experiments (C) MHC class II I-Ek positive TAMs were further analyzed by their frequency of expressing either arginase, NO, both or none. Data are compiled from three independent experiments (D) Frequency of NO and I-Ek expressing TAMs that were either positive or negative for arginase. Significance between groups was determined by an unpaired, two-tailed Student’s t-test with ***p ≤ 0.001. Data are compiled from two independent experiments.
