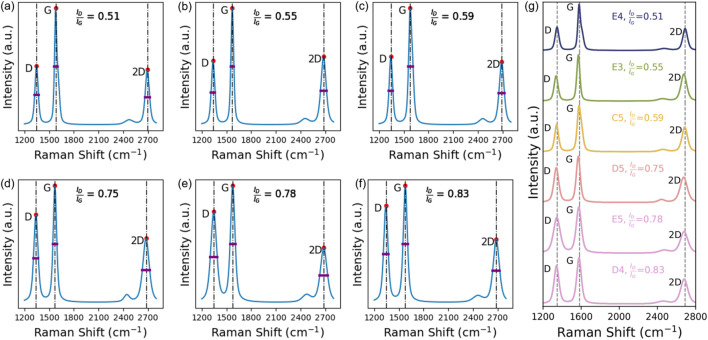
FIGURE 2.
(A–F) Raman spectra obtained for six samples with the best electrical properties. The representative (D, G) and 2D peaks are labeled, red circles are used to denote the relative positions of each peak, and a purple bar is used to denote the calculated full width at half maximum (FWHM) of the characteristic graphene peaks. The ID/IG ratio is used to characterize the defect density of the LIG samples. (G) A stacked Raman plot is used to show the peak positions of six samples with the best electrical properties. Vertical lines are placed at expected peaks to show slight Raman shifts within the samples, and the vertical lines are placed at the expected D peak:1,350 cm-1, G peak: 1,583 cm-1, and 2D peak: 2690 cm-1.

