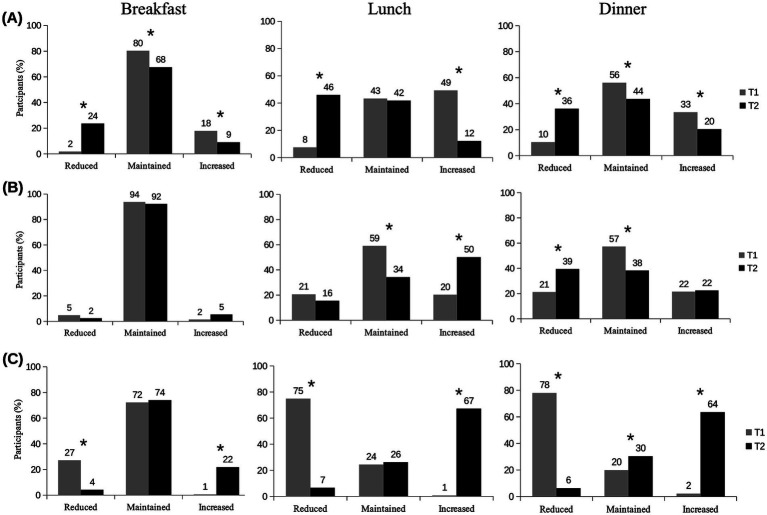
Figure 1.
Change in the consumption frequency of home-prepared meals (A), ready-to-eat food purchased from off-site services (delivery, take-away, drive-thru) (B), and meals consumed at on-site services (C) in T1 (compared to T0) and in T2 (compared to T1). n = 335; *p < 0.01. McNemar Test; Off-site refers to delivery, take-away, drive-thru; on-site refers to consumption at food service establishments; T0 = pre-pandemic period; T1 = approximately 6 months after the start of the COVID-19 pandemic; T2 = approximately 18 months after T1.

