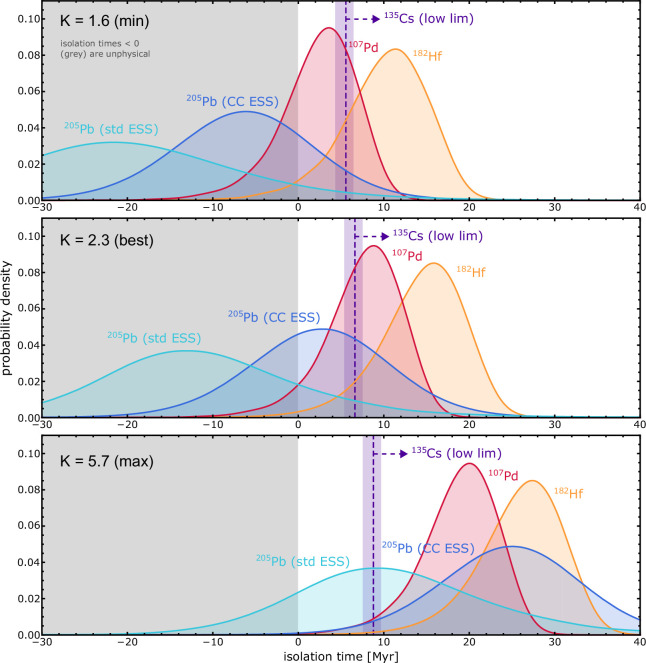
Extended Data Fig. 4. Probability density functions for the isolation time with varying K.
The same probability density functions plotted in Fig. 4 are replicated for the min/best/max values of the galactic evolution parameter K following equation (2) and including the lower limit derived from 135Cs/133Cs, which is represented by dashed lines as a reminder that its calculation assumes a different δ (approximately 1 Myr) than that for the other three isotopes (approximately 3 Myr). ESS and CC represent the standard early Solar System (ESS) value from ref. 9 and the carbonaceous chondrites (CC) ESS value from ref. 10, respectively.

