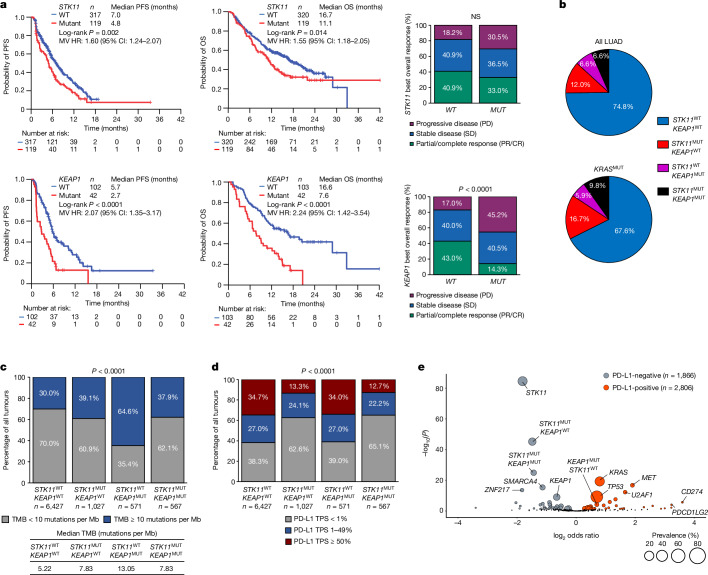
Fig. 1. Immunogenomic correlates and clinical outcomes with PCP chemo-immunotherapy in patients with STK11- and/or KEAP1-mutant advanced nsNSCLC.
a, PFS, OS and ORR with pemetrexed, carboplatin or cisplatin and pembrolizumab (PCP) in patients with STK11MUT (n = 119) versus STK11WT (n = 320) (top) or with KEAP1MUT (n = 42) versus KEAP1WT (n = 103) (bottom) advanced nsNSCLC. The comparison of ORR (partial response (PR)/complete response (CR)) in patients with STK11MUT versus STK11WT and KEAP1MUT versus KEAP1WT tumours was based on the chi-squared test. Log-rank test was used for comparisons of PFS and OS. Multivariate (MV) HRs (adjusted for age, ECOG performance status and presence of brain metastases) and 95% CIs were estimated using a Cox proportional hazards model. P ≤ 0.05 was considered statistically significant. NS, not significant. b, Prevalence of individual and combined STK11 and KEAP1 alterations in advanced LUAD (left; n = 8,592) or KRAS-mutated LUAD (right; n = 3,224) from the Foundation Medicine (FMI) database. c, TMB in single and double STK11MUT and/or KEAP1MUT and STK11WT/KEAP1WT LUAD in the FMI dataset. Median TMB (table insert) and fraction of tumours with a TMB of 10 or more mutations per Mb or fewer than 10 mutations per Mb (bar chart) in each subgroup are indicated. d, PD-L1 tumour proportion score (TPS) in single and double STK11MUT and/or KEAP1MUT and STK11WT/KEAP1WT LUAD in the FMI dataset (n = 8,836). The chi-squared test from a 2 × 4 contingency table was used to compare the distribution of PD-L1-positive (TPS ≥ 1%) and -negative (TPS < 1%) tumours across the four oncogenotypes. e, Volcano plot of enriched somatic genomic alterations in PD-L1-negative (TPS < 1%, grey circles) versus PD-L1-positive (TPS ≥ 1%, red circles) LUAD with an intermediate or high TMB (TMBI/H; six or more mutations per Mb; n = 4,672). The size of individual circles is proportional to the prevalence of the corresponding alteration. Two-sided Fisher’s exact test was used for statistical comparisons and statistical significance was established at false discovery rate (FDR)-adjusted P ≤ 0.05.

