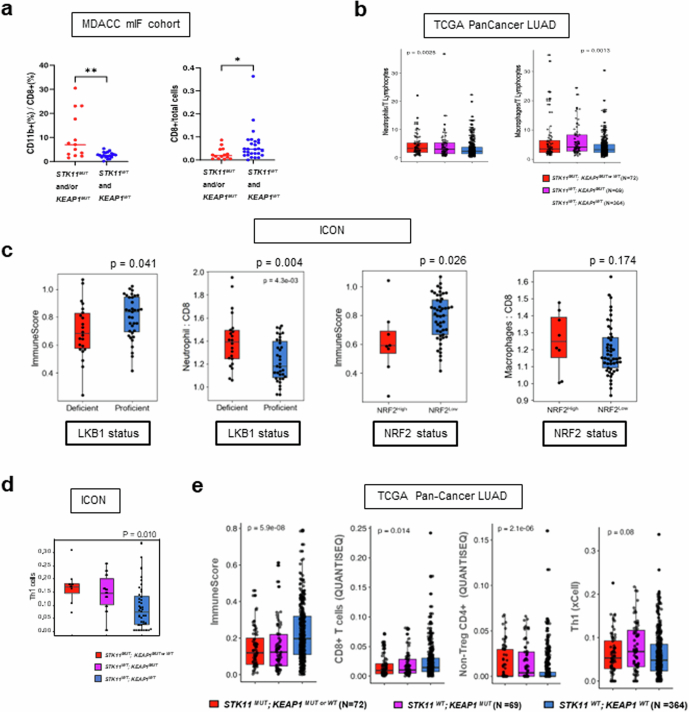
Extended Data Fig. 7. Characterization of the STK11MUT and/or KEAP1MUT NSCLC TIME in clinical cohorts.
a. Multicolour immunofluorescence (mIF) analysis of surgically resected early-stage human nsNSCLC confirms a higher ratio of CD11b+/CD8+ cells (N = 13, STK11MUT and/or KEAP1MUT and N = 19, STK11WT and KEAP1WT) and lower abundance of CD8+ T cells (N = 14; STK11MUT and/or KEAP1MUT and N = 27; STK11WT and KEAP1WT) in STK11MUT and/or KEAP1MUT NSCLC. The Mann–Whitney U test was used for statistical comparisons. b. Inferred neutrophil: T lymphocyte and macrophage: T lymphocyte ratios in STK11 and/or KEAP1-mutant LUAD in the TCGA dataset. The Kruskal–Wallis test was used for the three-group statistical comparisons. c. Immune contexture of LKB1-deficient (N = 22) versus LKB1-proficient (N = 35) (top row) and NRF2High (N = 8) versus NRF2Low (N = 49) (bottom row) nsNSCLC in the ICON cohort, based on previously validated gene expression signatures. The Mann–Whitney U test was used for statistical comparisons and P ≤ 0.05 was considered statistically significant. d. xCell-based digital deconvolution of the tumour immune microenvironment in the ICON cohort of surgically resected nsNSCLC (N = 8, STK11MUT;KEAP1MUTorWT; N = 10, STK11WT;KEAP1MUT;N = 39, STK11WT;KEAP1WT). Each box indicates the interquartile range (IQR) with the median and whiskers indicate the upper and lower values within 1.5 times the IQR. The Kruskal–Wallis test was used for the three-group statistical comparison and P ≤ 0.05 was considered statistically significant. e. RNA-seq-based deconvolution of the STK11MUT and or KEAP1MUT TIME in the TCGA PanCancer Atlas lung adenocarcinoma cohort. Left to right: ImmuneScore (assessed by xCell); CD8+ T cells (evaluated by QuanTIseq); non-Treg CD4+ T cells (QuanTIseq); and TH1 signature (xCell). Each box indicates the interquartile range (IQR) with the median and whiskers indicate the upper and lower values within 1.5 times the IQR. The Kruskal–Wallis H test was used for statistical comparisons.

