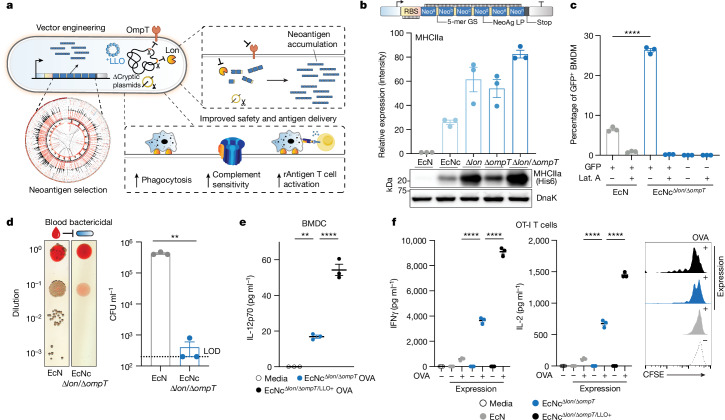
Fig. 1. Engineering live microbial tumour neoantigen vaccines.
a, Design of microbial tumour neoantigen vaccines, with a Circos plot of CT26 mutanome. b, Top, an optimized synthetic neoantigen construct schematic. Middle, relative immunoblot chemiluminescent intensity of neoantigen construct MHCIIa expressed from EcN versus derivative strains (n = 3 biological replicates per group). Bottom, a representative immunoblot of neoantigen construct MHCIIa expression in a designated strain. c, Percentage of GFP+ BMDMs after incubation with EcN or EcNcΔlon/ΔompT expressing constitutive GFP (n = 3 biological replicates per group, ****P < 0.0001, two-sided unpaired Student’s t-test); Lat. A, latrunculin A. d, Left, a representative image of EcN or EcNcΔlon/ΔompT spotted on an LB agar plate after incubation in human blood. Right, a microbial burden in colony-forming units (CFU) per ml (CFU ml−1) (n = 3 biological replicates per group, **P = 0.0039, two-sided unpaired Student’s t-test with Welch’s correction). Limit of detection (LOD) was 2 × 10² CFU ml−1. e, IL-12p70 quantification in culture supernatants of pulsed BMDCs (n = 3 biological replicates per group, **P = 0.0018, ****P < 0.0001, one-way ANOVA with Tukey’s multiple comparisons test). f, Naive OT-I T cells were incubated with pulsed BMDCs. Left, IFNγ quantification of supernatants of OT-I cultures (n = 3 biological replicates per group, ****P < 0.0001, one-way ANOVA with Tukey’s multiple comparisons test). Middle, IL-2 quantification of supernatants of OT-I cultures (n = 3 biological replicates per group, ****P < 0.0001, one-way ANOVA with Tukey’s multiple comparisons test). Right, a representative histogram of carboxyfluorescein succinimidyl ester (CFSE) dilution-stimulated OT-I T cells. b–f, Data are mean ± s.e.m. Gel source data are in Supplementary Figs. 1 and 2.

