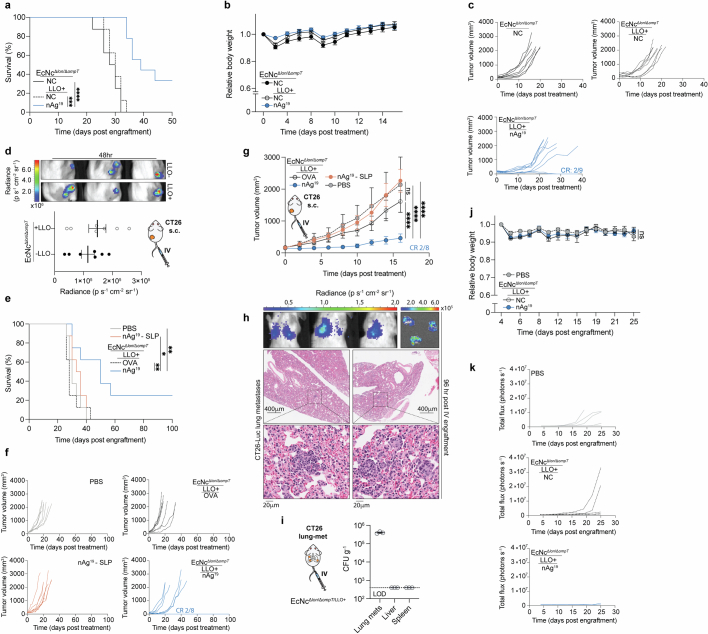
Extended Data Fig. 5. Intravenous treatment with engineered microbial therapeutics in primary and metastatic solid tumors.
a–c, BALB/c mice with established hind-flank CT26 tumors were intravenously injected with indicated microbial therapeutics when average tumor volumes were 150–200 mm3 (n = 9 mice for EcNcΔlon/ΔompT/LLO+ nAg19, 8 for other groups). a, Kaplan-Meier survival curves for CT26-tumor-bearing mice treated with indicated therapeutic (****P < 0.0001, **P = 0.0021, Log-rank Mantel-Cox test). b, Relative body weight of mice after intravenous treatment with indicated microbial therapeutic. c, Individual tumor trajectories after intravenous treatment with the indicated microbial therapeutic. d, BALB/c mice with established hind-flank CT26 tumors were intravenously injected with EcNcΔlon/ΔompT or EcNcΔlon/ΔompT/LLO+. Upper: representative luminescent signature of tumors colonized with EcNcΔlon/ΔompT (LLO−) or EcNcΔlon/ΔompT/LLO+ (LLO + ), 48 h post-injection. Lower: average radiance of colonized tumors (n = 7 mice per group). e–f, BALB/c mice with established hind-flank CT26 tumors were intravenously injected with the indicated microbial therapeutics or PBS, or subcutaneously injected with nAg19-SLP, when average tumor volumes were 100–120 mm3. e, Kaplan-Meier survival curves for CT26 tumor-bearing mice treated with indicated therapeutic (n = 8 mice per group, **P = 0.0055, **P = 0.0018, *P = 0.0210, Log-rank Mantel-Cox test). f, Individual tumor trajectories (n = 8 mice per group) after intravenous treatment with the indicated therapeutic. g, Established hind-flank CT26 tumors were intravenously injected with the indicated microbial therapeutics or PBS, or subcutaneously injected with nAg19-SLP, when average tumor volume was 160 mm3. Tumor growth curves (n = 5 mice for PBS, 8 mice for other groups; ****P < 0.0001, two-way ANOVA with Tukey’s multiple comparisons test). h–k, BALB/c mice were injected intravenously with CT26-Luc cells. h, Upper-left: In vivo, or Upper-right: ex vivo bioluminescent images of mice (n = 3) lungs 96 h post-intravenous injection of CT26-Luc cells. Lower: Histology of metastatic lung foci 96-hours post-intravenous injection of CT26-Luc cells. i–k, Every 3–5 days mice (n = 5 per group) received intravenous injection of PBS, EcNcΔlon/ΔompT/LLO+ without therapeutic (NC), or EcNcΔlon/ΔompT/LLO+ nAg19 starting 4 days after CT26-Luc engraftment. i, Microbial tissue burden quantified as CFU g−1, LOD 4 ×10² CFU g−1 (n = 3 mice). j, Relative body weight of mice (n = 5 per group) after intravenous treatment with indicated therapeutic. k, Individual lung metastases luminescence trajectories (n = 5 mice per group). b,d,g,i,j Data are mean ± s.e.m.

