
Fig. 3. Microbial tumour neoantigen vaccines restructure the tumour immune microenvironment.
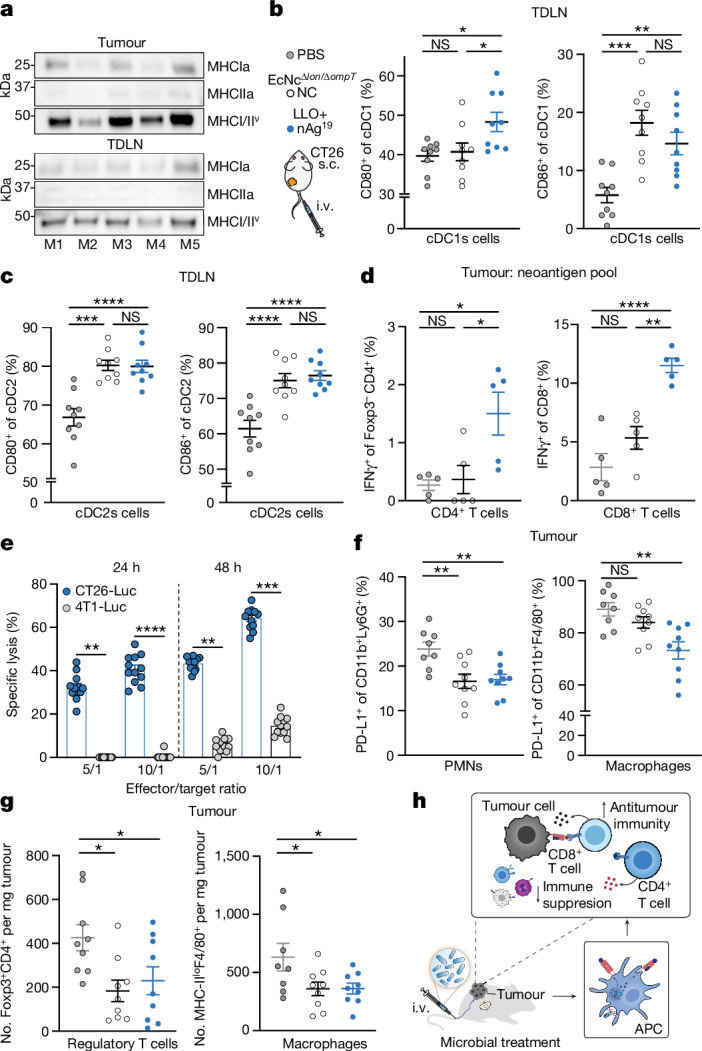
a, Immunoblot of tumours (n = 5) and TDLNs (n = 5). b, Left, the percentage CD80+ of cDC1s (*P = 0.0189, *P = 0.0415; NS, P > 0.05). Right, the percentage CD86+ of cDC1s (**P = 0.0061, ***P = 0.0002; NS, P > 0.05). c, Left, the percentage CD80+ of cDC2s (****P < 0.0001; NS, P > 0.05). Right, the percentage CD86+ of cDC2s (***P = 0.0001, ****P < 0.0001; NS, P > 0.05). d, Left, the frequency of IFNγ+Foxp3−CD4+ (n = 5 mice per group, *P = 0.0238, *P = 0.0147; NS, P > 0.05). Right, the frequency of IFNγ+CD8+ T cells (n = 5 mice per group, **P = 0.0015, ****P < 0.0001; NS, P > 0.05). e, CT26 TILs, specific lysis (n = 12 mice, **P = 0.0023, **P = 0.0027, ***P = 0.001, ****P < 0.0001; NS, P > 0.05, Kruskal–Wallis test with Dunn’s multiple comparisons test). f, Left, the percentage PD-L1+ of Ly6G+CD11b+ (n = 8 mice for PBS, n = 9 for other groups, **P = 0.0037, **P = 0.0059). Right, the percentage PD-L1+ of CD11b+F4/80+ (n = 8 mice for PBS, n = 9 for all other groups, **P = 0.0010; NS, P > 0.05). PMNs, polymorphonuclear cells. g, Left, the number of Foxp3+CD4+ T cells mg−1 (n = 9 mice per group *P = 0.0131, *P = 0.0241). Right, the number of MHC-IIlo+F4/80+ CD11b+ macrophages per mg (n = 8 mice for PBS, n = 9 for other groups, *P = 0.0385, *P = 0.0407). h, Immunologic mechanism. b–d,f,g, One-way ANOVA with a–d, Tukey’s, f, Dunnett’s or g, left, Holm–Šídák’s or right, Dunnett’s multiple comparisons test. b,c, n = 9 mice per group. b–g, Data are mean ± s.e.m. Gel source data are in Supplementary Fig. 2.