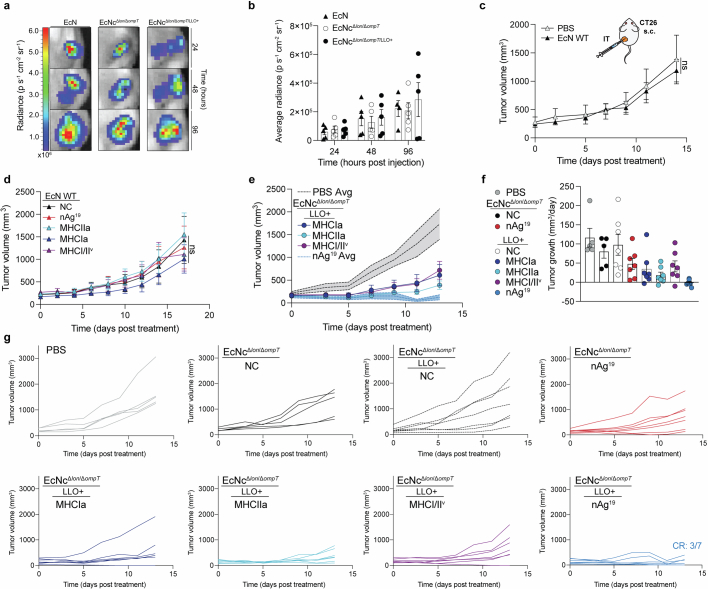
Extended Data Fig. 3. Characterization of intratumoral treatment with microbial tumor neoantigen vaccines.
a–g, BALB/c mice with established hind-flank CT26 tumors were treated when average tumor volumes were 150–200mm3. a,b, Mice received a single intratumoral injection of EcN WT, EcNcΔlon/ΔompT, or EcNcΔlon/ΔompT/LLO+. a, Representative image of tumors colonized by microbes with a genome-integrated luminescence cassette. b, Average radiance of microbe colonized tumors in designated (n = 4 mice for EcN WT 96 h, 5 for all other groups). c, Mice received intratumoral injections of PBS or EcN WT. Tumor growth curves (n = 5 mice per group, ns = P > 0.05, two-way ANOVA with Tukey’s multiple comparisons test). d, Mice received intratumoral injections of EcN WT without therapeutic (NC), expressing construct MHCIa, MHCIIa, or MHCI/IIv, or EcN nAg19. Tumor growth curves (n = 5 mice per group, ns = P > 0.05, two-way ANOVA with Tukey’s multiple comparisons test). e,f, Mice received a single intratumoral injection of PBS, EcNcΔlon/ΔompT NC, EcNcΔlon/ΔompT nAg19, or EcNcΔlon/ΔompT/LLO+ expressing construct MHCIa, MHCIIa, or MHCI/IIv, or EcNcΔlon/ΔompT/LLO+ nAg19. e, Tumor growth curves (n = 5 mice for PBS, 7 for other groups). f, Tumor growth rate (n = 5 mice for PBS and EcNcΔlon/ΔompT NC, 7 for other groups) for designated groups. g, Individual tumor trajectories after intratumoral treatment with PBS or indicated microbial therapeutic. b–f, Data are mean ± s.e.m.

