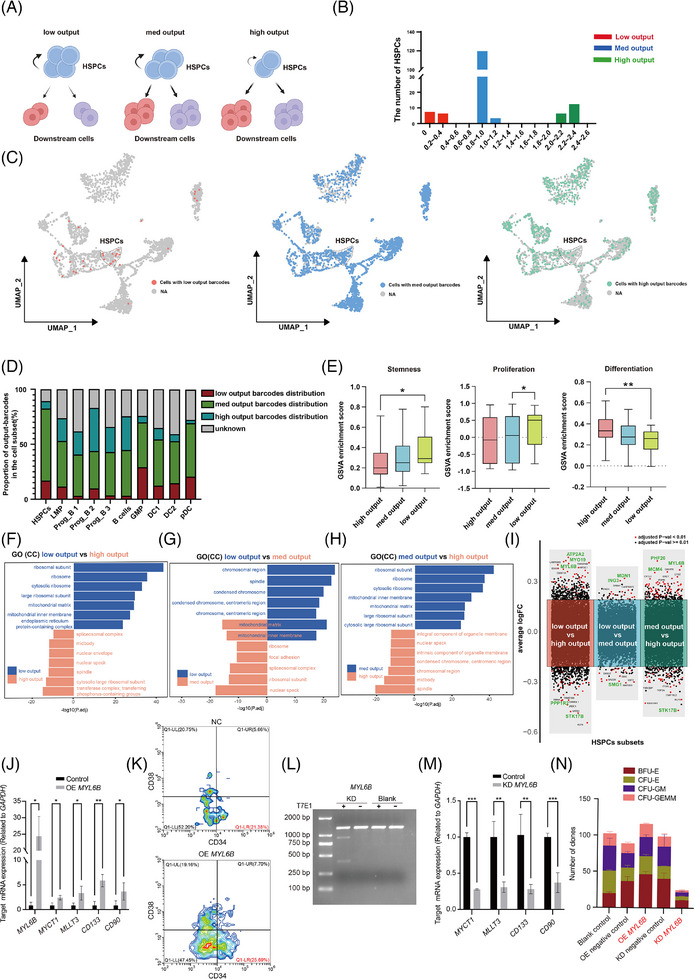
FIGURE 2.

Identification and characterization of human HSPCs with different output capabilities using SCALeBa. (A) The schematic diagram shows the homeostasis and differentiation of HSPCs with low, med, and high outputs. The low‐output HSPCs exhibit more self‐renewal, the med‐output HSPCs maintain a balance between self‐renewal and downstream differentiation, and the high‐output HSPCs tend to downstream differentiation. (B) The output value of HSPCs is calculated by comparing the distribution ratio of cells with the same barcode between other cells and HSPCs. High outputs, value > 2.0, med outputs, .8 < value < 1.2, and low outputs, value <.4. (C) The UMAP plot visually presents the distribution of HSPCs and their progeny cells with different output values. (D) The proportion of cells with different barcodes in barcode‐positive cells in each cell lineage. (E) The GSVA plot displays the scoring of the three output subsets in relation to the gene sets associated with stemness, proliferation (GO:0071425), and differentiation (GO:0060218). p‐value was calculated by t‐test, *p < .05; **p < .01. (F–H) The bidirectional gene enrichment plot for GO (Gene Ontology) CC (Cell Component) shows the enrichment of cellular components between the low, med, and high output HSPCs subsets. (I) The volcano plots showing the differential gene expression between low, med, and high output HSPCs subsets. The different subset‐related genes are shown in red and blue respectively in each panel. Key genes are highlighted in green. (J) The expression levels of MYL6B and other reported stemness genes were upregulated in HSPCs that were transduced with a lentiviral vector for the overexpression of MYL6B. The error bars are the SD. *p < .05; **p < .01. (K) The proportion of CD34+CD38− cells was increased in HSPCs overexpressing MYL6B. (L) The MYL6B indels were induced by CRISPR/Cas9 editing, as determined by the T7 endonuclease assay. (M) The expression levels of reported stemness genes were decreased in HSPCs that were transduced with CRISPR/Cas targeting MYL6B. The error bars are the SD. *p < .05; **p < .01; ***p < .001. (N) CFU assay results of human HSPCs with overexpression or knockdown of MYL6B. n = 2, the error bars are the SEM.
