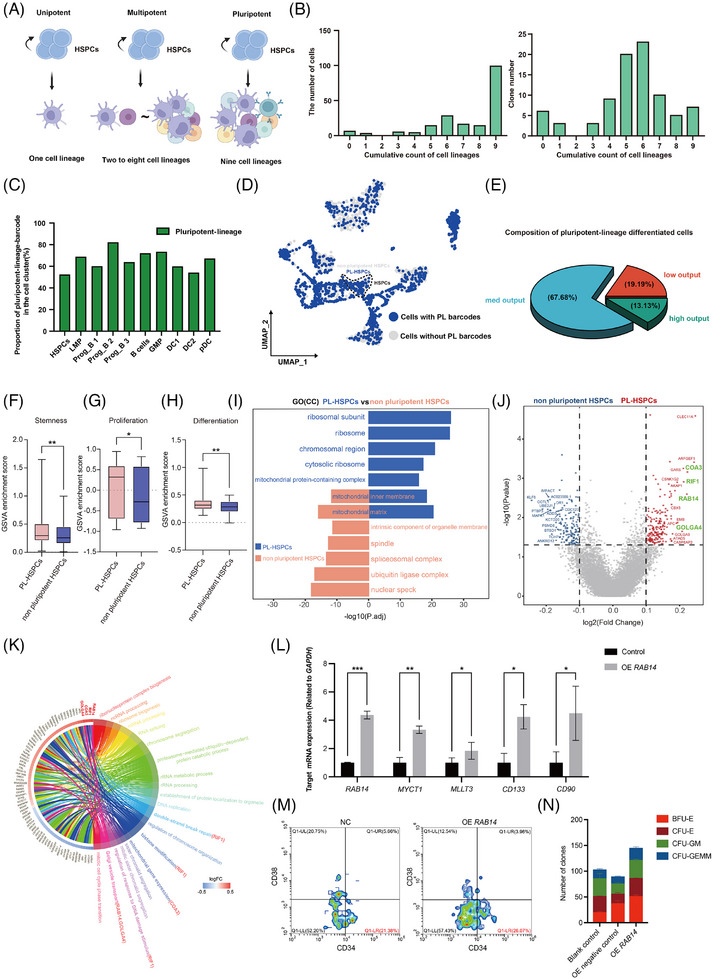
FIGURE 3.

Identification of pluripotent HSPCs subset and its differential gene expression using SCALeBa. (A) The schematic diagram shows that the unipotent, multipotent, and pluripotent HPSCs subsets, which refer to the HSPCs that can differentiate into one cell lineage (n = 1), multiple cell lineages (n = 2∼8) and all cell lineages (n = 9), respectively. (B) The number of unique cell lineages for barcode distribution is denoted as the M‐value. An M‐value of 9 indicates the distribution of one barcode across all cell lineages. Additionally, the clone count corresponding to barcodes with different M values is also presented. (C) The bar chart displays the proportion of cells with pluripotent barcodes in barcode‐positive cells in each cell lineage. (D) The UMAP plot visually presents the pluripotent HSPCs subset and their progenies. (E) The Venn diagram shows the composition of pluripotent‐lineage HSPCs in terms of output values. (F–H) The GSVA plot displays the scoring of the PL‐HSPCs (pluripotent‐lineage) to non‐pluripotent HSPCs in relation to the gene sets associated with stemness, proliferation, and differentiation. p‐value was calculated by t‐test, *p < .05; **p < .01. (I) The GO(CC) bidirectional gene enrichment plot illustrates the enrichment of cellular component terms between the TL HSPCs and non‐pluripotent HSPCs. (J) The volcano plot illustrates the differential gene expression between the PL‐HSPCs and non‐pluripotent HSPCs. PL‐HSPCs and non‐pluripotent HSPCs‐related genes are shown in red and blue, respectively. Key genes are highlighted in green. (K) Circle plot illustrates the signalling pathways enriched for differentially expressed genes between the PL‐HSPCs and non‐pluripotent HSPCs subsets. (L) The expression levels of RAB14 and other reported stemness genes were upregulated in HSPCs that were transduced with a lentiviral vector for the overexpression of RAB14. The error bars are the SD. *p < .05; **p < .01; ***p < .001. (M) The proportion of CD34+CD38− cells was increased in HSPCs overexpressing RAB14. (N) CFU assay results of human HSPCs with overexpression of RAB14. n = 2. The error bars are the SEM.
