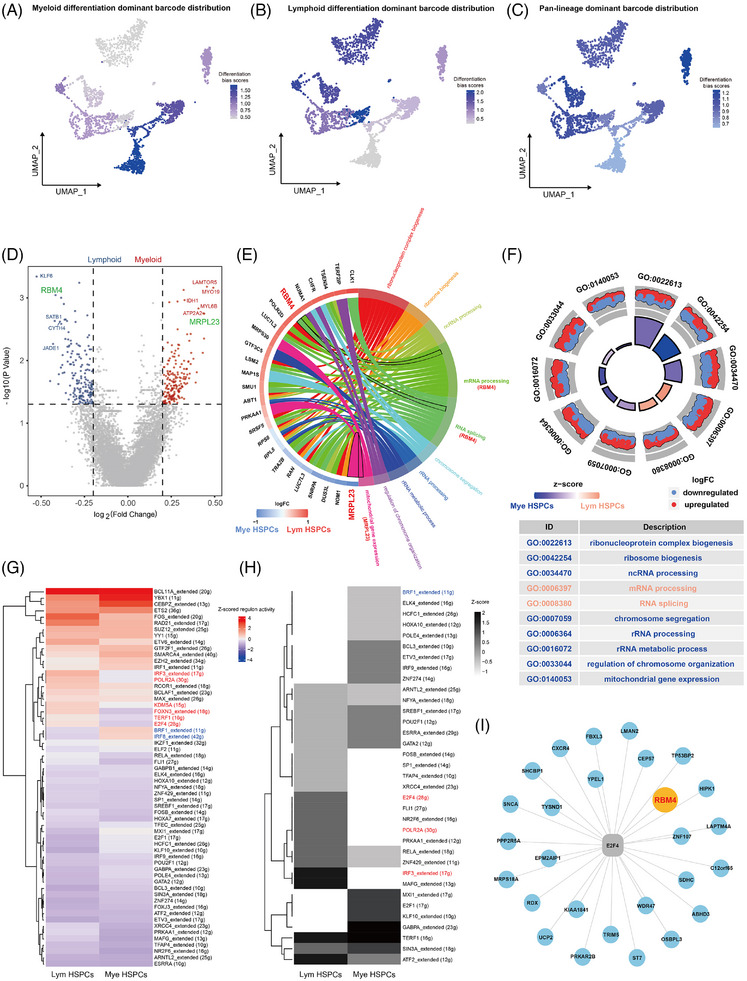
FIGURE 4.

Identification and characterization of human HSPCs with biased differentiation using SCALeBa. (A–C) The UMAP plot visually presents the barcoded subsets with differentiation bias and pluripotency. (D) The volcano plot illustrates the differential gene expression between Mye and Lym HSPCs subsets. Mye HSPCs and Lym HSPC‐related genes are shown in red and blue, respectively. Key genes are highlighted in green. (E) Circle plot illustrates the signalling pathways enriched for differentially expressed genes between the Lym HSPCs and Mye HSPCs subsets. (F) GO enrichment circle diagram shows the signalling pathways enriched by the differential genes of Lym HSPCs and Mye HSPCs, and the GO term ID and description are shown in the table. (G) The AUC values of all cells in Lym HSPCs and Mye HSPCs were normalized for presentation. The colour keys from blue to red indicate AUC values from low to high. The names of regulons specifically upregulated in Lym HSPCs are shown in red, and the names of regulons upregulated in Mye HSPCs are shown in blue. (H) The binary regulon activity matrix was distributed and plotted as a heat map from the AUC of SCENIC, and the values of regulons in Lym HSPCs and Mye HSPCs were normalized. The dark colours in the diagram indicate the ON status of corresponding regulons. (I) The network diagram shows the genes regulated by the E2F4.
