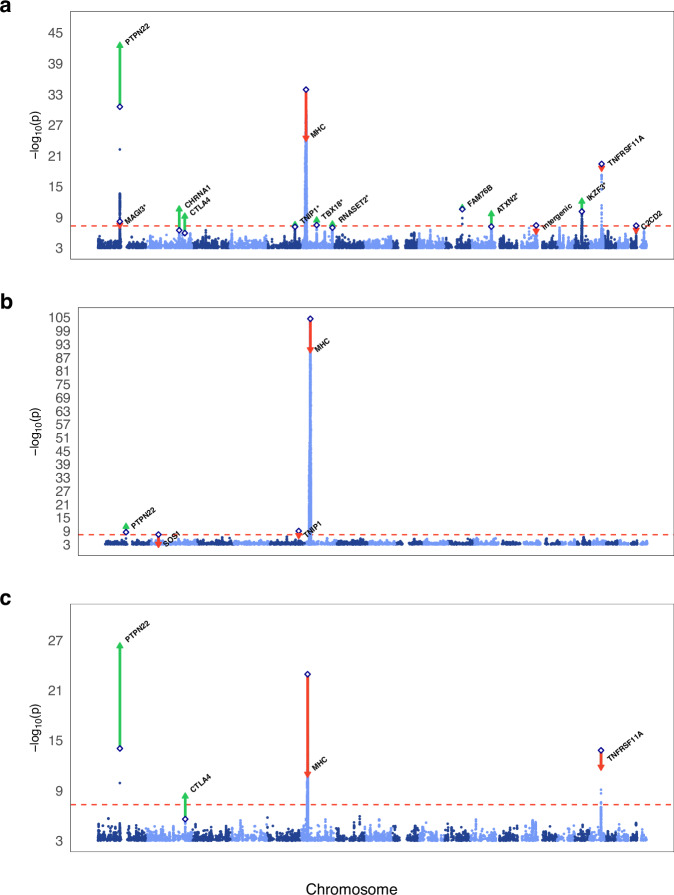
Fig. 1. Manhattan plots depicting GWAS results.
Plot a depicts the GWAS results for the full MG dataset, plot b shows the results of the early-onset MG GWAS, and plot c displays the results of the late-onset MG GWAS. The two-sided -log10 P-values from the inverse-variance-weighted fixed-effects meta-analyses are plotted on the y-axis and the chromosomal position on the x-axis in ascending order from chromosome 1 through 22. The dashed red horizontal line marks the Bonferroni corrected genome-wide significance threshold (P < 5e−8). Diamonds represent the index SNPs of the discovery GWAS. Red downward triangles indicate the index SNPs with a higher P-value in the replication and discovery meta-analysis while green upward triangles represent index SNPs with a lower P-value. Asterisks (*) indicate associations not previously reported.

