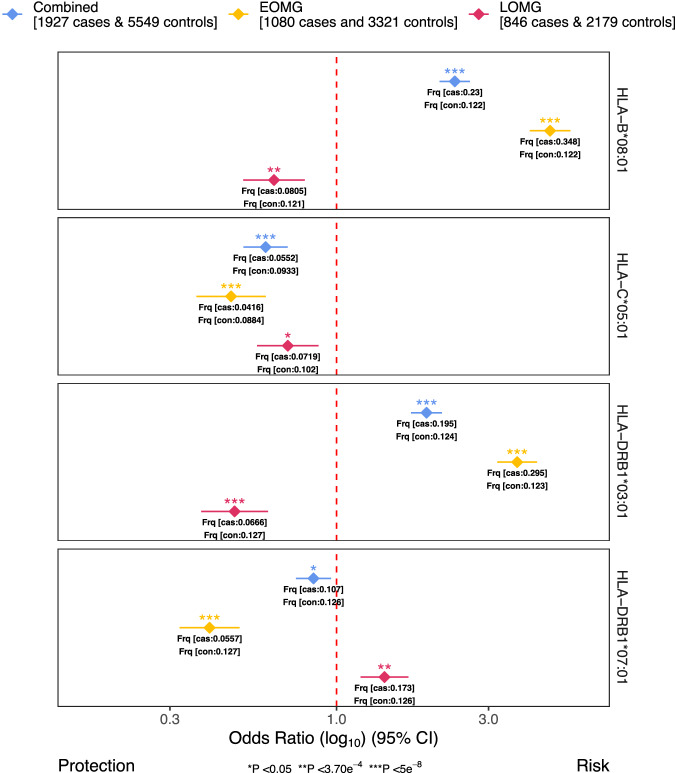
Fig. 2. HLA association analysis results.
The forest plot displays the top risk-conferring and protective HLA allele across all main analyses. The log10 of the odds ratio (OR) from inverse-variance-weighted fixed-effects meta-analysis is indicated as diamonds for each HLA allele and dataset used along with the 95% confidence intervals (error bars). Different P-value significance levels are indicated by asterisks for nominally significant (P < 0.05*), Bonferroni-corrected (P < 3.70e−4**), and genome-wide (P < 5e−8***). MG myasthenia gravis; EOMG early-onset myasthenia gravis, LOMG late-onset myasthenia gravis.

