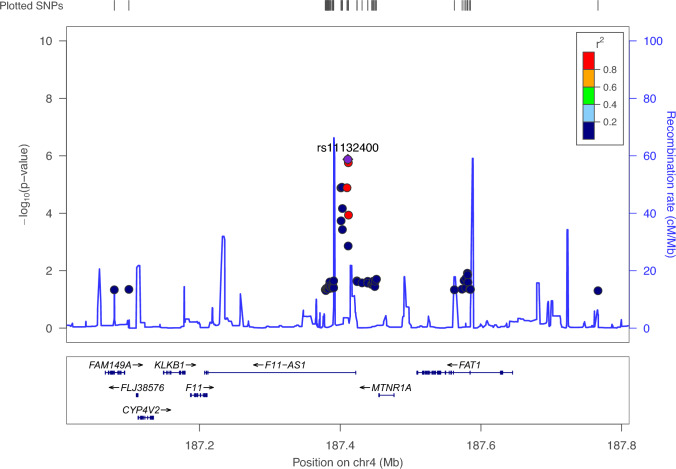
Fig. 3.
Regional plot of top-associated locus from fixed-effects meta-analysis. The plot shows the genomic context of associated signal (lead variant: rs11132400T, p = 1.33 × 10⁻⁶, OR = 0.58) mapping to intronic region of F11-AS1 gene. The plot was generated with LocusZoom tool (http://locuszoom.sph.umich.edu). The − log10(p) of associations from fixed-effect meta-analysis is reported on left y-axis, and the recombination rate on right y-axis, over the genomic position (hg19). Each symbol represents one SNP, with the most associated SNP marked in purple and shading of the other points based on the linkage disequilibrium metrics with the top SNP. Positions of genes are shown below the plot

