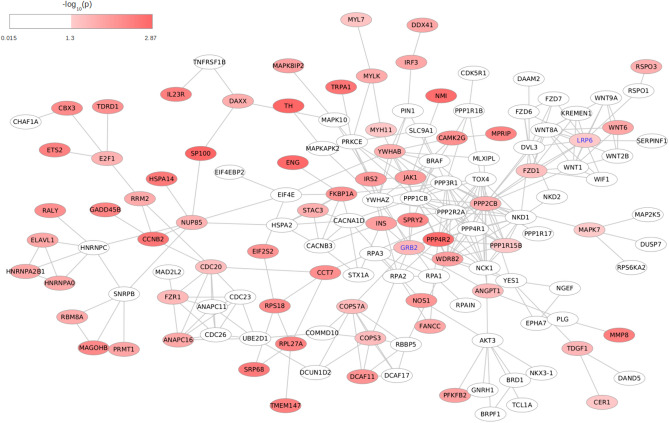
Fig. 4.
Detected network module. The final subnetwork resulting from the merge of modules, residing in top 1% of graph scores assigned by dmGWAS search algorithm, associated with response to NTZ. Color coding of nodes represents meta-analytic gene-level p values from MAGMA analysis, as indicated by the legend. Nodes/genes with association p > 0.05 were left white. Two genes which showed high level of centrality metrics and have already been implicated with MS (GRB2 and LRP6) are highlighted

