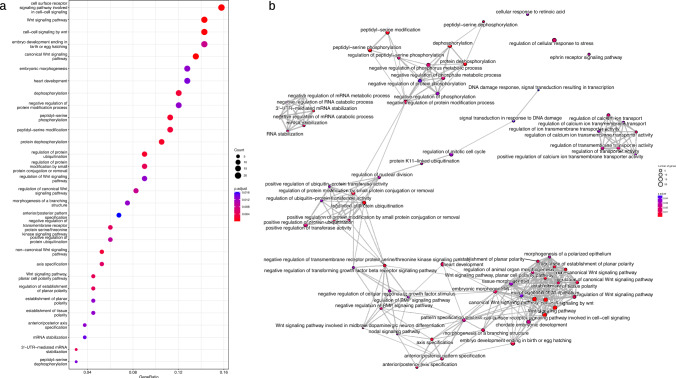
Fig. 5.
Enriched terms from over-representation analysis of genes in the detected network module against Gene Ontology Biological Process database. a Dotplot displaying the first 30 associated GO terms. p values were calculated from hypergeometric test, with adjustment for multiple testing with Benjamini–Hochberg procedure at FDR < 5%. The Count parameter in the legend illustrates the number of genes annotated to GO term and belonging to module. On x-axis, Gene Ratio reports the ratio between the number of genes in the module annotated to the term and the overall number of genes in the module (N = 135). b Enrichment map, reporting a graph-based representation of semantic similarity measures between GO terms enriched at FDR < 5% (N = 75, see Supplementary Table 3). Terms with high similarity tend to cluster together: the stronger the similarity, the shorter and thicker the edges. The color of nodes is coded according to p.adjust from hypergeometric test, as reported in the legend. Similarity between terms was computed with Jaccard correlation coefficient

