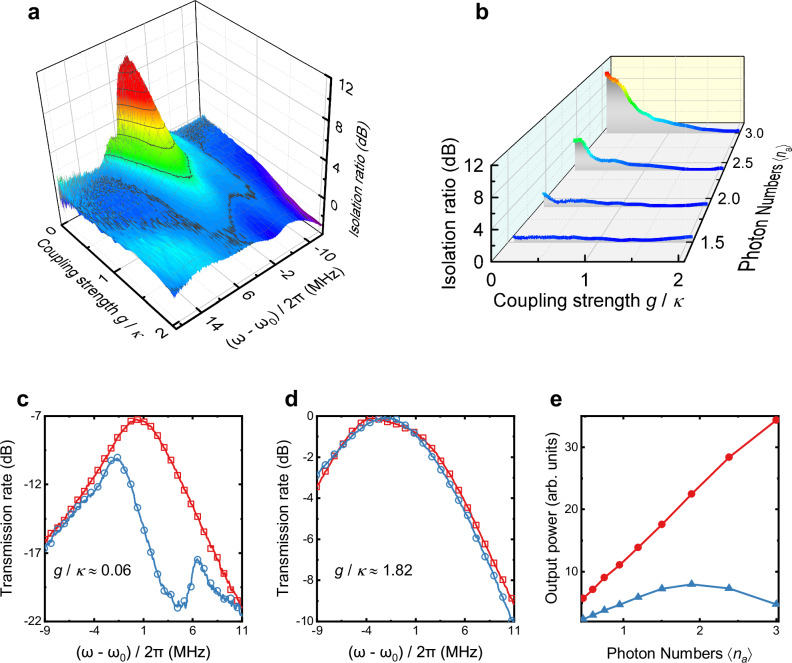
Fig. 3. Few-photon nonreciprocity.
a Isolation ratio versus the effective coupling strength and the detuning frequency between the frequency of the probe field and the frequency of the cavity mode with . b Isolation ratio versus effective coupling strength and the average photon numbers inside the cavity with MHz. c Comparison of forward (blue, in Fig. 1a) and backward (red, in Fig. 1a) transmission rates in the weak-coupling regime. d Same as c in the strong-coupling regime. The transmission rates in c and d are defined as and have been normalized, where and are the input and output complex amplitudes of the probing fields. e The forward output power versus the average photon numbers with MHz. The red circle data are measured with effective coupling strength . The blue triangle data are measured with coupling strength . The sweep direction for a–e is from low frequency to high frequency, from forward to backward, and from low power to high power.

