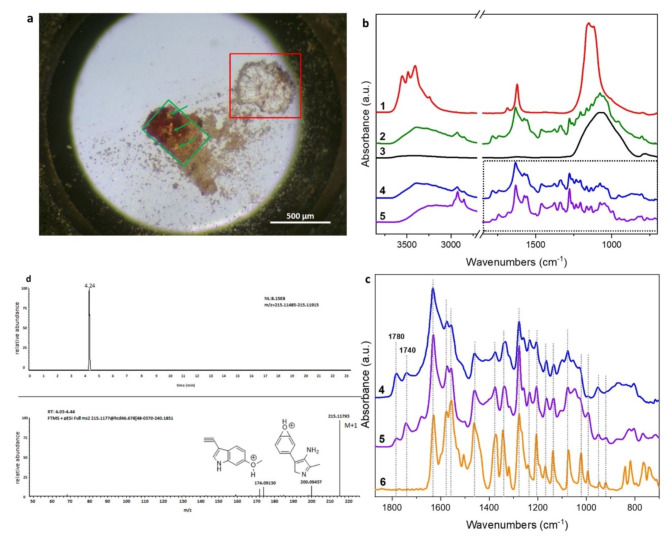
Fig. 3.
(a) optical image of sample TMA2. (b)1: average spectrum of the region in the red frame of panel a; 2: average spectrum of the region in the green frames in panel a, the green arrows indicate the pale orange areas were the most intense spectra were collected; 3: average spectrum of sample TMA1; 4: subtraction spectrum obtained by subtracting 2–3; 5: Syrian rue seeds hydroalcoholic extract. (c) Fingerprint region of spectrum 4 and 5 compared with a harmaline reference spectrum (6). (d) HRMS spectrum and structure of harmaline.

