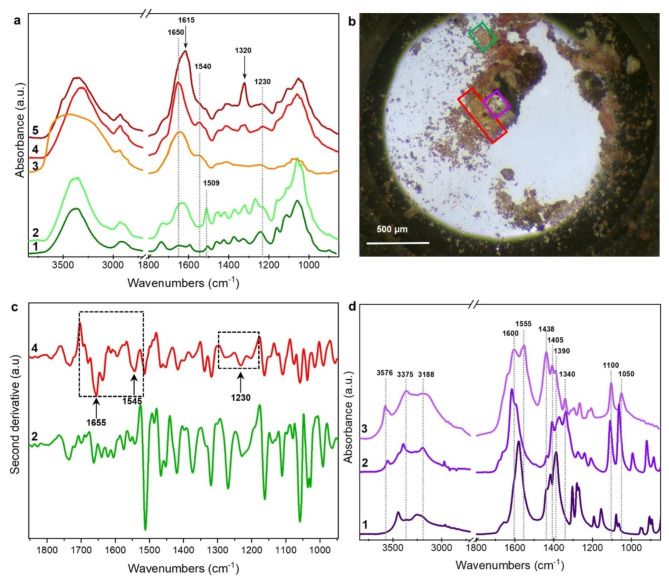
Fig. 4.
(a) 1: reference spectrum of modern wood sample; 2: average spectrum of the region in the green frames in panel b; 3: reference spectrum of royal jelly; 4 and 5: average spectra collected in the area in the red frame of panel b; (b) optical image of sample TMA3. (c) second derivative spectra in the range 1900 –900 cm− 1 of spectra 2 and 4 in panel a. (d) 1: reference spectrum of a sodium citrate; 2: reference spectrum of sodium tartrate; 3: average spectrum collected in the area in the purple frame of panel b.

