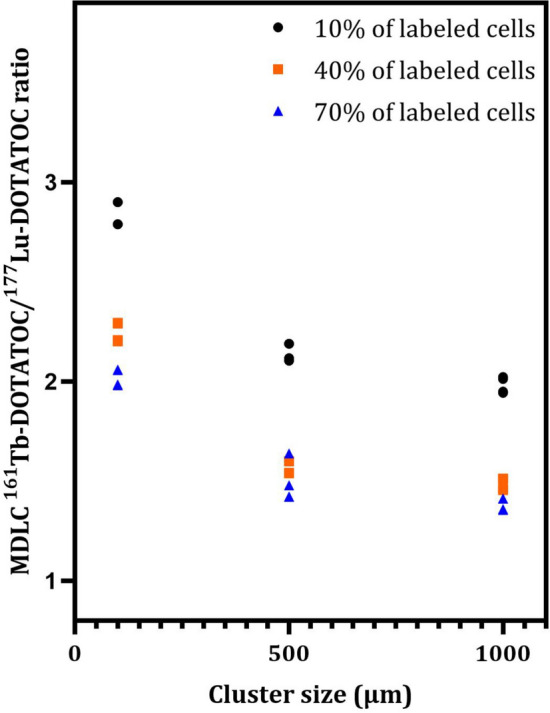
Fig. 3.

161 Tb-DOTATOC/177Lu-DOTATOC ratios of the mean doses to nuclei of labeled cells (MDLC) calculated for the three different cluster sizes (radius of 100, 500, and 1000 µm) and 10, 40, or 70% of labeled cells. For each cluster size and percentage of labeling, four points are reported in the plot, corresponding to the activity levels presented in Table 5. A two-way ANOVA analysis with a significance level of 0.05 (three columns and twelve rows, with a total of 36 observations) revealed significant differences in the MDLC 161Tb-DOTATOC/177Lu-DOTATOC ratios among cluster sizes (54.67% of total variation; P < 0.0001) and percentages of labeled cells (54.67% of total variation; P < 0.001). Tests of Tukey's multiple comparisons showed significant differences between the following combinations of labeled cells: 10% vs. 40% (P < 0.001), 10% vs. 70% (P < 0.0001), and 70% vs. 40% (P < 0.0001). Significant differences were also observed when comparing 100 µm vs. clusters of 500 µm (P < 0.0001) and clusters of 100 µm vs. clusters of 1000 µm (P < 0.0001). However, a comparison of clusters of 500 µm vs. clusters of 1000 µm revealed no significant difference (P = 0.9977)
