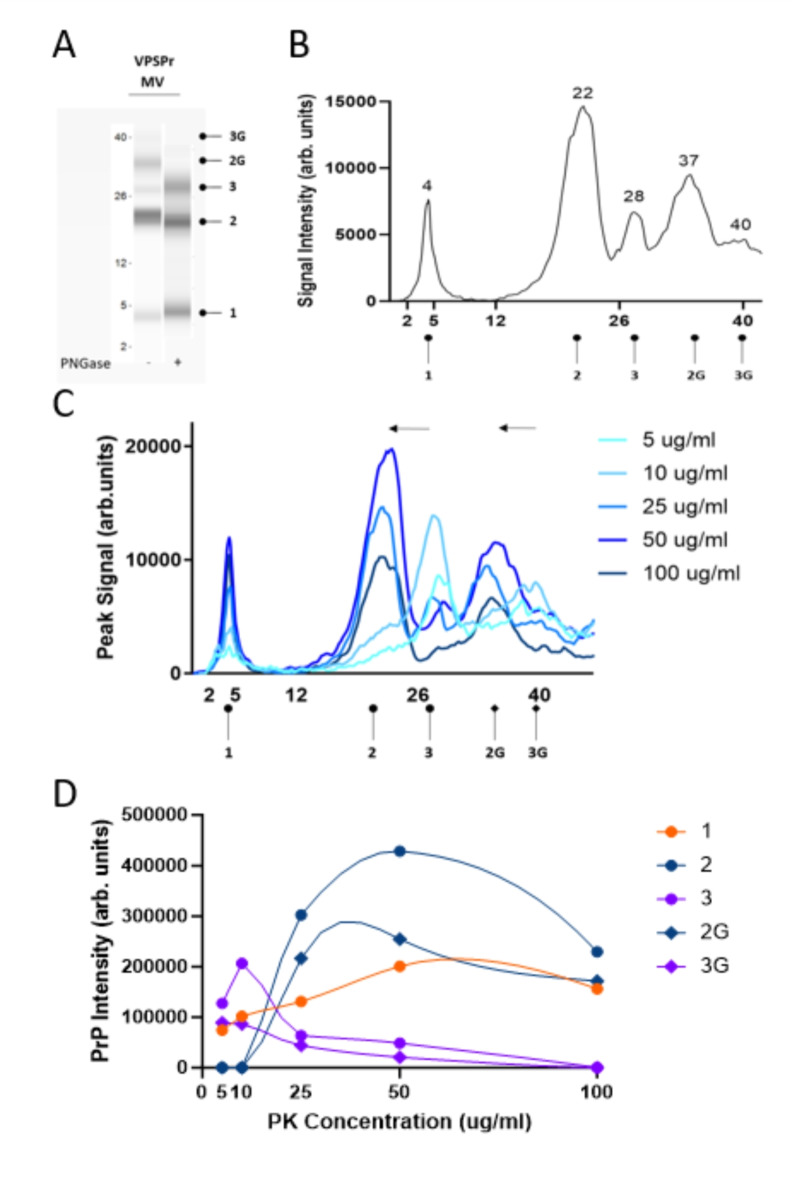
Fig. 3.
Electrophoretic profiles of VPSPr129-MV fragments and their sensitivity to proteinase-K digestion. (A) Mock “western blot view” of VPSPr129-MV digested with 25 µg/ml of PK treated with or without PNGase using the CE assay. Fragments are labelled according to convention described in Figure 2. (B) Electrophoretogram of VPSPr129-MV digested with 25 µg/ml of PK (C) Electrophoretogram of PK-titration assay of a VPSPr129-MV case. The arrows demonstrate the shift from a higher molecular weight to a lower molecular weight due to the truncation of fragments as PK concentrations increase (3 → 2 and 3G → 2G). (D) Graph showing the PrP signal intensity change of each VPSPr fragment throughout the PK titration assay.

