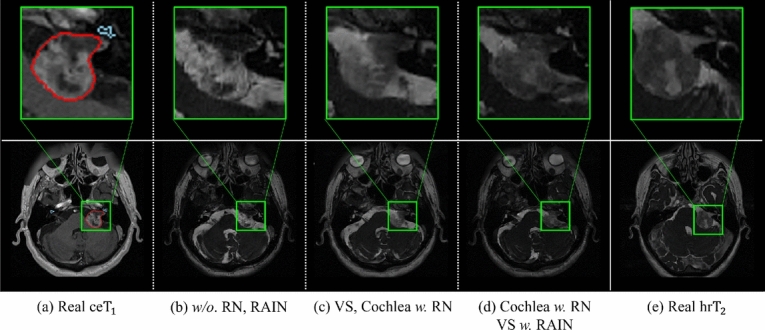
Fig. 4.

Visualization of the effectiveness of RN and RAIN for VS (red) and cochleas (sky-blue) according to different normalization configurations of TANQ; (a) real images, (b)-(d) pseudo- images from images generated by TANQ with different normalization configurations, and (e) real images. In the real images, the intensity of the VS is higher than that of other tissues due to the contrast agent, while the VS in the real images shows similar intensity to other tissues. Conversely, the cochlea exhibits very low intensity in real images (a), whereas it appears relatively distinct in real images (e).
