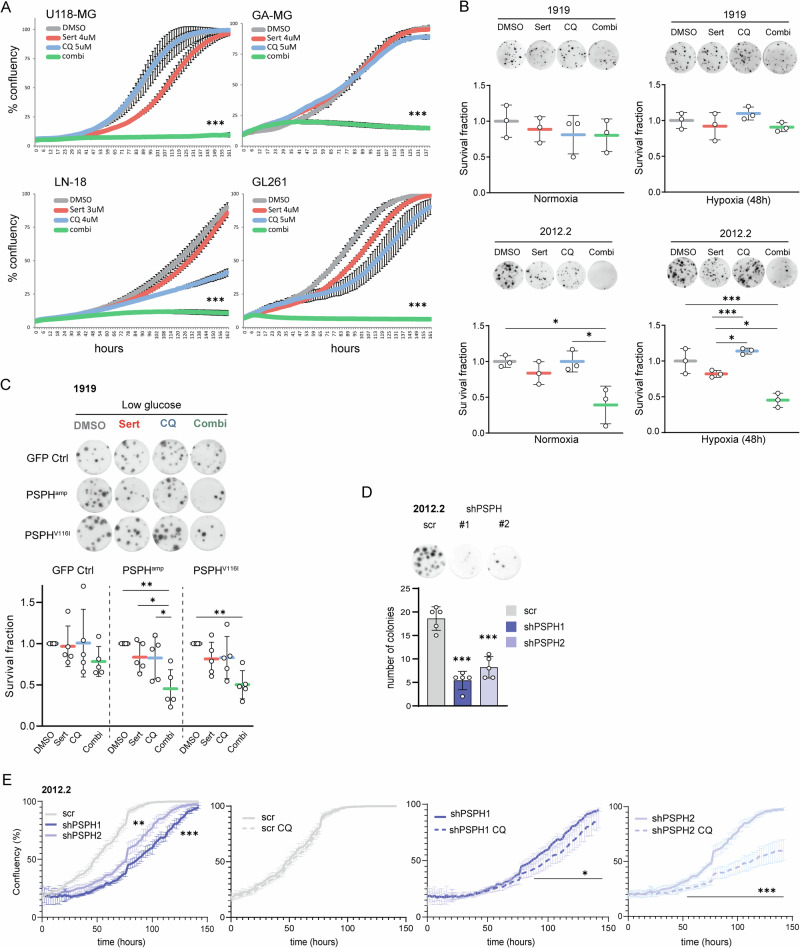
Fig. 4. Combined sertraline and chloroquine treatment efficiently targets ser/glyhigh GBMs.
A Incucyte confluency monitoring of human and mouse GBM cell models as readout for cell proliferation in response to sertraline (red), chloroquine (blue) or combined treatment (green) as compared to a DMSO control (gray). B Alvetex 3D clonogenic assays in ser/glyhigh 2012.2 GBM cells and ser/glylow 1919 GBM cells upon combined sertraline and chloroquine treatment, under both normal oxygen and hypoxic conditions. Each individual dot represents an independent experiment. One-way ANOVA with Tukey’s multiple comparison test has been performed. C Alvetex 3D clonogenic assay in GFP Ctrl, PSPHamp, PSPHV116I GBM 1919 cells treated with DMSO, sertraline, chloroquine, or the combination treatment in low glucose conditions. Each individual dot represents an independent experiment. One-way ANOVA with Tukey’s multiple comparison test has been performed, comparing each treatment to their respective DMSO controls in each model. D Alvetex 3D clonogenic assay and the quantification of ser/glyhigh 2012.2 GBM cells comparing scrambled control cells to PSPH knockdown cells for their clonogenic capacity using two independent shRNAs, shPSPH #1 and #2 respectively (representative of 3 biological repeats). One-way ANOVA with Tukey’s multiple comparison test has been performed compared to the scrambled control. E Incucyte confluency monitoring of GBM cells as readout for cell proliferation 72 h after transduction plating 2000 cells per well in 6 replicates to profile the effect of PSPH knockdown (shPSPH1 blue, shPSPH2 light blue) in ser/glyhigh 2012.2 GBM cells as compared to scrambled control cells and in response to chloroquine (striped line) treatment. One-way ANOVA with Tukey’s multiple comparison test has been performed to determine the effects of PSPH targeting compared to the scrambled control. For CQ effectiveness over time multiple unpaired t tests with False Discovery Rate (FDR) was performed with q-values < 0.05 determining the actual point of CQ impact on growth curve deviation. Statistical significance p < 0.05 (*), p < 0.01 (**), p < 0.001 (***), and q < 0.05 (*), q < 0.001 (***).

