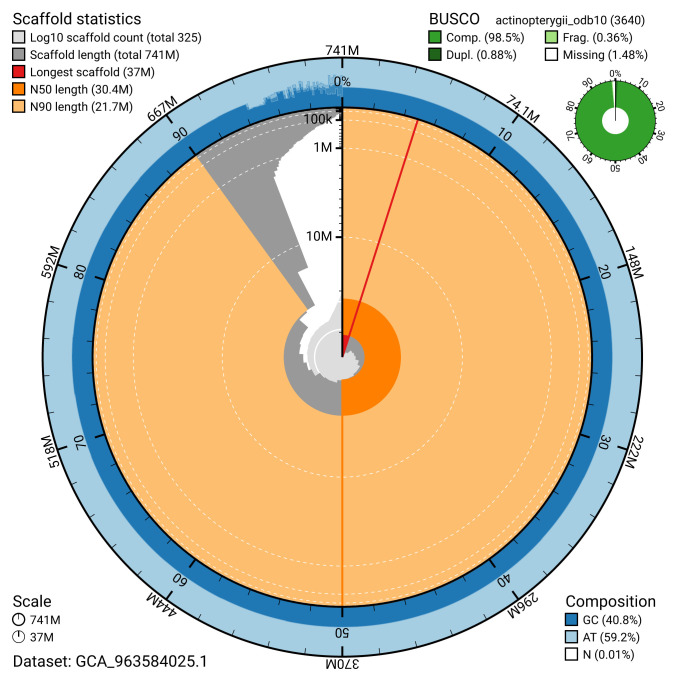
Figure 2. Genome assembly of Labrus mixtus, fLabMix1.1: metrics.
The BlobToolKit snail plot shows N50 metrics and BUSCO gene completeness. The main plot is divided into 1,000 size-ordered bins around the circumference with each bin representing 0.1% of the 740,579,663 bp assembly. The distribution of scaffold lengths is shown in dark grey with the plot radius scaled to the longest scaffold present in the assembly (36,961,920 bp, shown in red). Orange and pale-orange arcs show the N50 and N90 scaffold lengths (30,403,003 and 21,671,947 bp), respectively. The pale grey spiral shows the cumulative scaffold count on a log scale with white scale lines showing successive orders of magnitude. The blue and pale-blue area around the outside of the plot shows the distribution of GC, AT and N percentages in the same bins as the inner plot. A summary of complete, fragmented, duplicated and missing BUSCO genes in the actinopterygii_odb10 set is shown in the top right. An interactive version of this figure is available at https://blobtoolkit.genomehubs.org/view/GCA_963584025.1/dataset/GCA_963584025.1/snail.

