FIGURE 2.

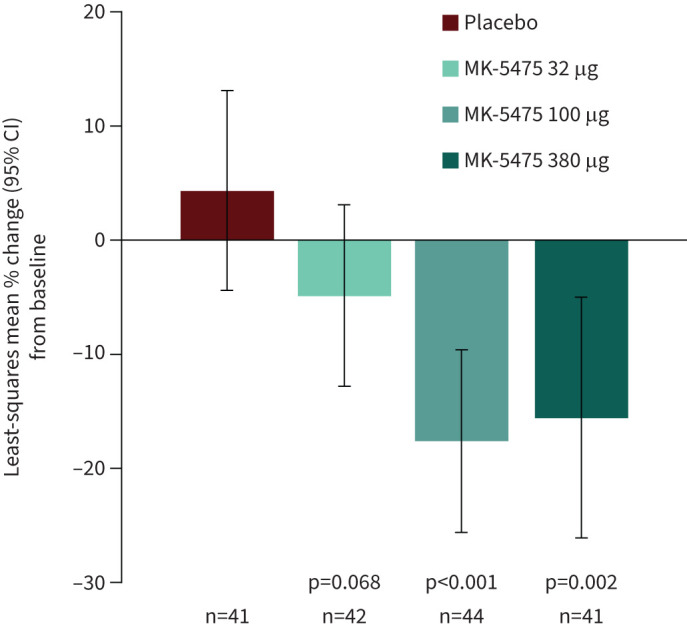
Least-squares mean percent change (with 95% confidence intervals) from baseline at week 12 for the primary endpoint of pulmonary vascular resistance.

Least-squares mean percent change (with 95% confidence intervals) from baseline at week 12 for the primary endpoint of pulmonary vascular resistance.