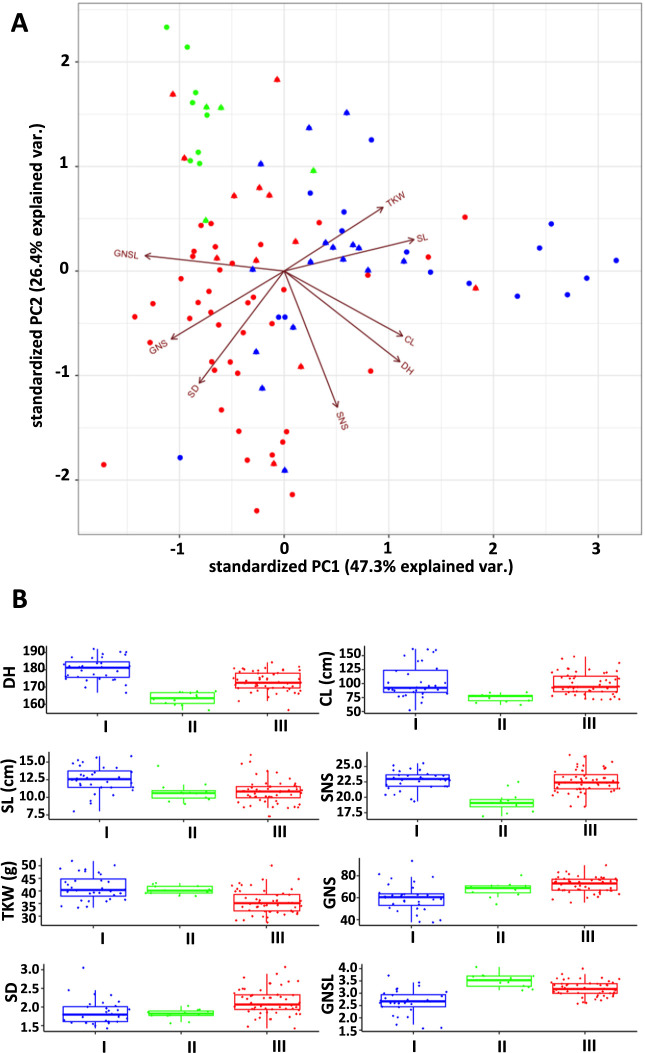
Fig. 2.
Phenotypic variation among populations of the JWC accessions. Scatterplot of the first two components (PC1 and PC2) from the principal component analysis (PCA) based on data for the phenotypes of eight traits in 96 JWC accessions (A). Blue, green, and red indicate the accessions belonging to populations I, II and III, respectively. Triangles show the admixed accessions (estimated admixture proportion of <0.9). Length of the arrows depicts the strength of the contribution of the feature in that direction. Comparison of eight traits among three populations (B). Mean values with the same letters are not significantly different (p > 0.05) (Tukey–Kramer’s HSD test). DH, days to heading; CL, culm length; SL, spike length; SNS, spikelet number per spike; TKW, thousand-kernel weight; GNS, grain number per spike; SD, spike density; GNSL, grain number per spikelet.

