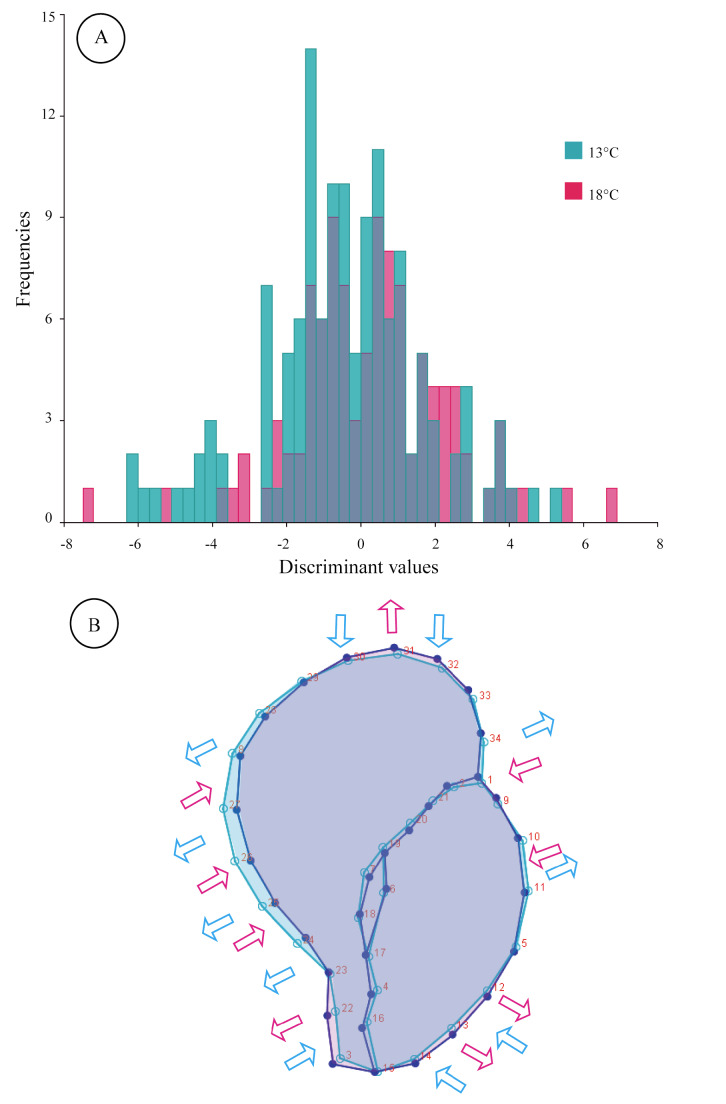
Fig. 4.
A-Frequencies of discriminant values predicted by the cross-validation test. B-The image shows the mean of the shape of each treatment overlapped, increasing the variation three times. The 13°C and 18°C shapes are shown in light blue and pink, respectively. Arrows indicate the general direction of the shell shape variation.

