
FIGURE 5.
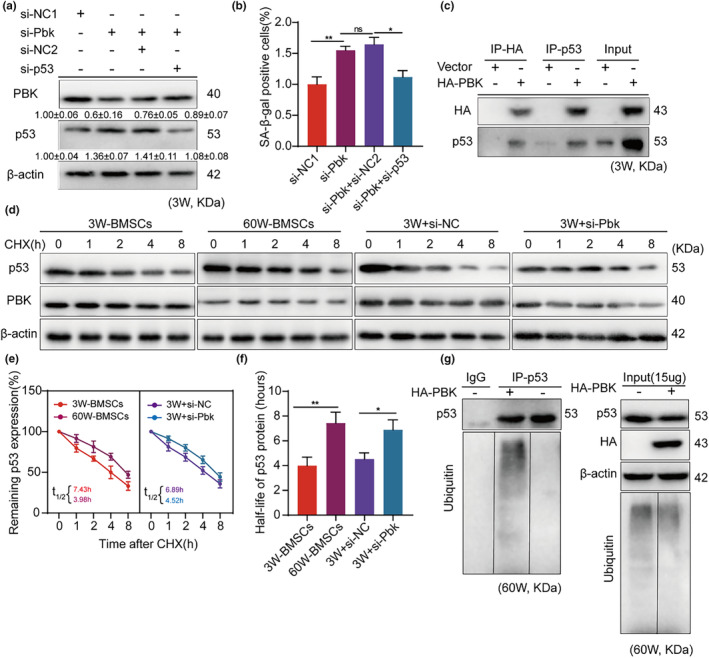
Pbk promotes the degradation of p53. (a) The expression of Pbk and p53 was determined by protein blotting in young BMSCs after knockdown of the Pbk group and subsequent p53 treatment. (b) The rates of SA‐β‐gal‐positive cells in the four groups were compared and statistically analysed after knockdown of the Pbk group and then p53 treatment in 3W‐BMSCs. (c) Immunoprecipitation analysis of HA‐pbk transfected 60W BMSCs by protein blotting with anti‐HA or anti‐p53 antibodies. (d–f) Cycloheximide treatment followed by protein blotting for p53 protein stability analysis. (g) Ubiquitination assay in BMSC with and without ectopic Pbk expression. Immunoprecipitation of control IgG and p53 and protein blotting using anti‐p53 and anti‐ubiquitin antibodies to detect ubiquitin proteins (left). Identical loading levels of proteins and global ubiquitination profiles are shown (right). β‐Actin was used as a loading control. *p < 0.05; **p < 0.01.