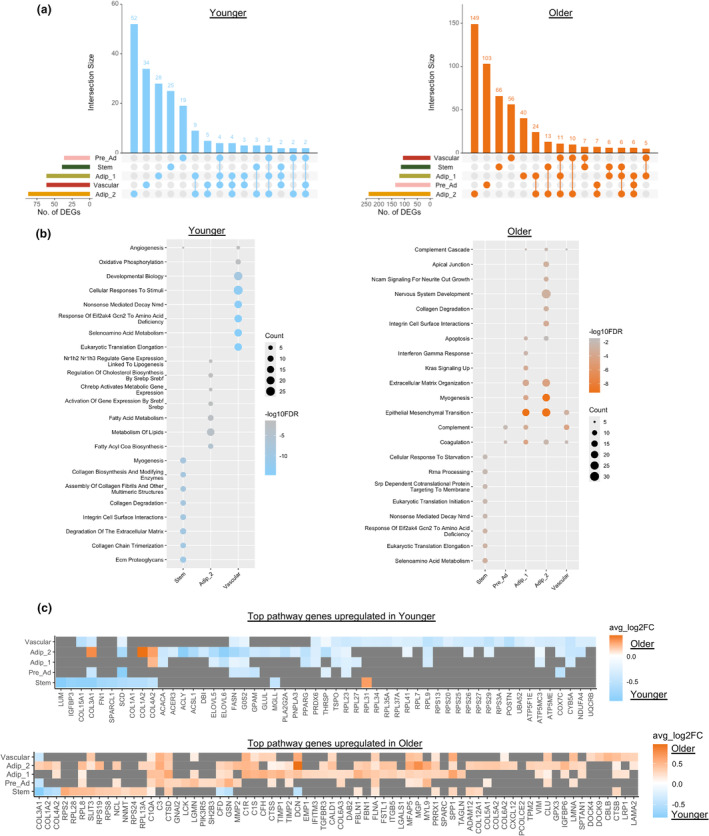
FIGURE 3.

Cell‐type transcriptional differences between older and younger participants. Upset plots showing overlap of differentially expressed genes (DEGs) (adjusted p value < 0.05 and logFC > 0.25) between cell types that are upregulated in younger and older groups (a). Top Hallmark and Reactome pathways significantly (FDR < 0.05) upregulated in each cell type for the younger and older group determined by an overrepresentation test on significantly (adjusted p value < 0.05) upregulated (logFC > 0.25) genes highlighting cell‐type transcriptional differences between the groups (b). If a cell type is not present, it did not have a significant pathway upregulated. Heatmaps of top differentially expressed genes contributing to the top pathways upregulated in the younger (upper panel) and older (lower panel) groups (c). Tiles that are grey do not have gene expression significantly different between older and younger groups for that cell type.
