FIGURE 4.

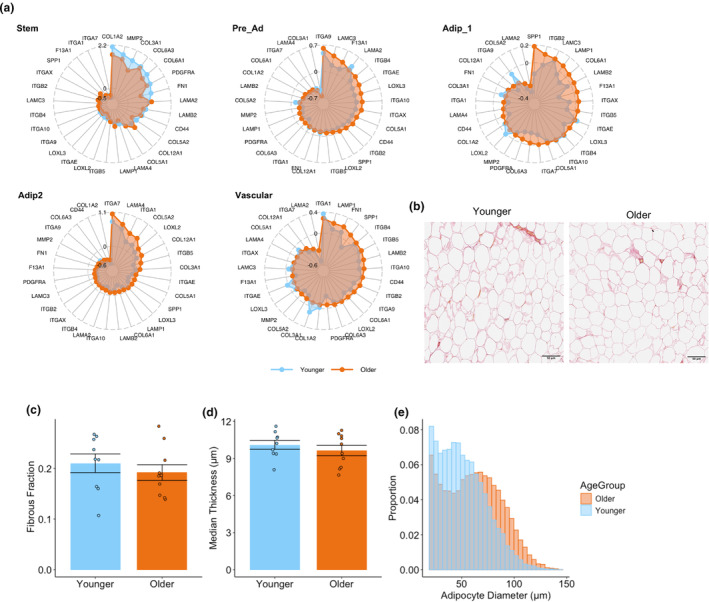
Fibrosis in aging WAT. Radar plots of differentially expressed extracellular remodeling and fibrosis genes in different cell types highlighting increased fibrosis in the older group in non‐stem cell populations (a). Representative picrosirius red staining in white adipose tissue in younger and older group (b). The fraction of adipose tissue with picrosirius red staining between younger and older group was not significantly different (c). The average median fibrosis thickness of each adipocyte between younger and older was not significantly different (d). Combined histogram of adipocyte size distribution normalized for total counts and split by age (e).
