FIGURE 5.

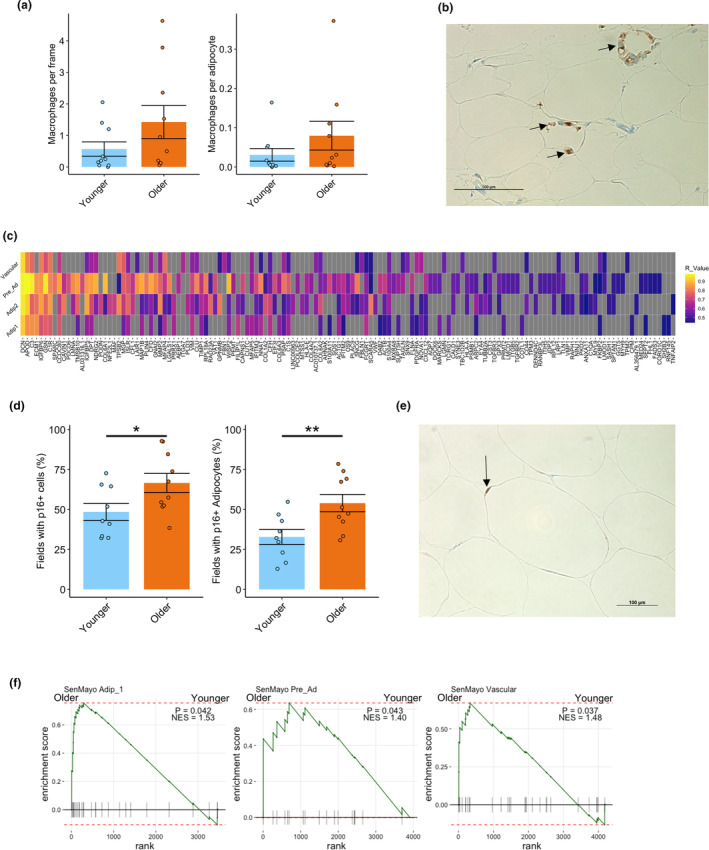
Macrophages and senescence in aging WAT. The number of macrophages per frame and per adipocytes stained for CD68 was not significantly different between the younger and older group (a). Representative image of macrophage crown‐like structure in the older group stained for CD68 (b). Heatmap of genes that positively correlated with CXCL14 expression in cell types that show markers of inflammation and fibrosis in the older group (c) Tiles that are grey do not have significant positive correlation to CXCL14 expression for that cell type. The percentage of 20X magnification fields that had cells and adipocytes with p16 staining was greater in older compared to younger participants (d). Representative image of p16 cell staining from an older individual with p16 in and adipocyte highlighted (e). GSEA plots of the SenMayo gene set showing greater enrichment in older compared to younger participants for Adip_1, Pre_Ad and Vascular cells (f). *p < 0.05; **p < 0.01. GSEA, gene set enrichment analysis.
