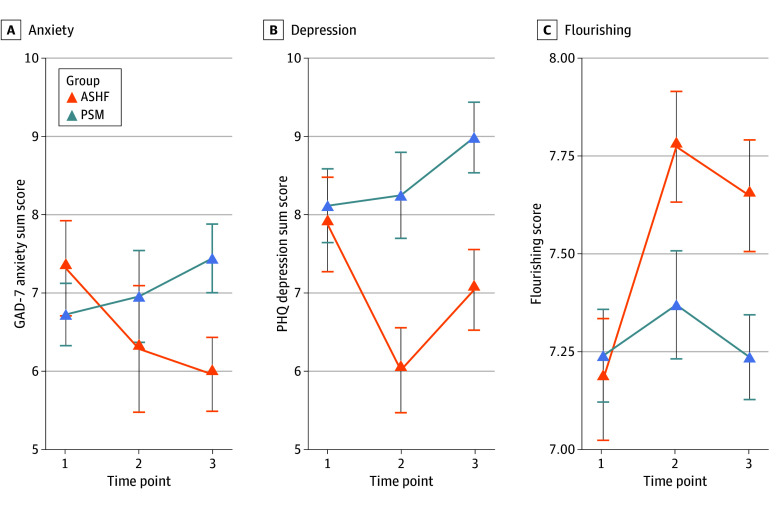
Figure. Longitudinal Trajectories of Anxiety, Depression, and Flourishing by Group.
The figure shows anxiety symptom scores (A), depressive symptom scores (B), and flourishing scores (C). Descriptive data are plotted. Error bars are SE of the mean. The x-axis is time: time point 1 is baseline; time point 2 is posttest (ie, the end of the semester during which baseline was assessed). Data from time point 2 are not used in the statistical models reported in this article; time point 3 is collected during the SARS-CoV-2 lockdown in Spring 2020. ASHF indicates Art and Science of Human Flourishing course participants; GAD-7, Generalized Anxiety Disorder 7-Item; PHQ, Patient Health Questionnaire; PSM, propensity score–matched control participants.

