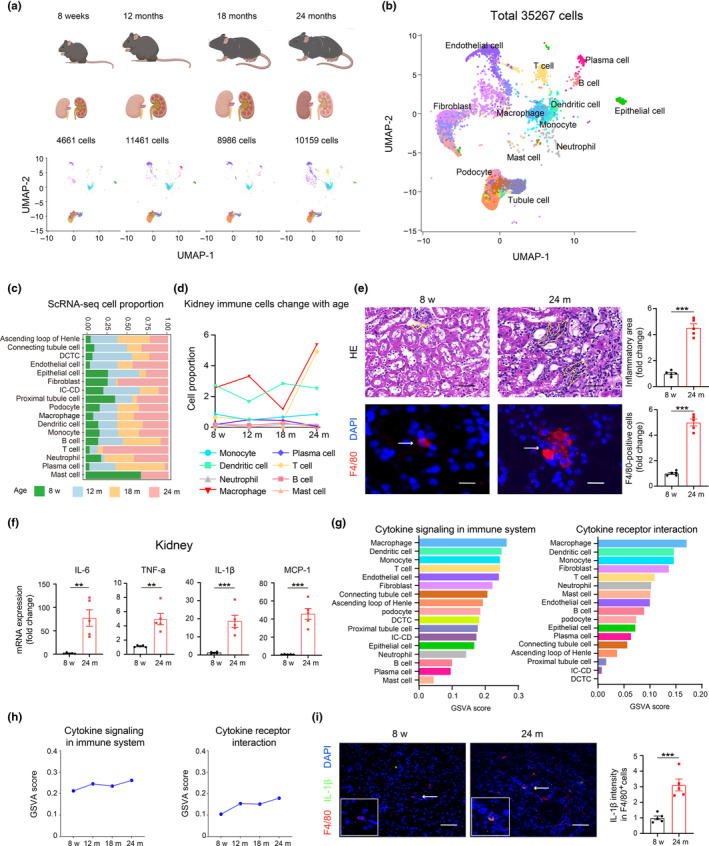
FIGURE 1.

Single‐cell RNA sequencing data revealed increased macrophage inflammation during renal aging. (a, b) UMAP visualization of single cells from kidneys across all stages of mice, colored by cluster identity. Our analysis utilized single‐cell transcriptomic data from the Cell Landscape database. (c) The proportion of various cell types during renal aging. (d) The proportion of major immune cell types changed with renal aging. (e) HE staining in kidney tissues from five young and five aged mice (upper). Representative images and quantification of the inflammatory focus area (yellow line) were shown. Scale bars, 20 μm. Representative immunofluorescence images and quantification analysis of macrophages marker F4/80 (arrow) in kidney tissues (Lower). Scale bars, 20 μm. (f) RT‐qPCR analysis of IL‐6, TNF‐a, IL‐1β and MCP‐1 mRNAs in kidney tissues from five young and five aged mice. (g) GSVA score of the cytokine signaling in immune system and cytokine receptor interaction were calculated for all types of renal cells. (h) GSVA score of the cytokine signaling in immune system and cytokine receptor interaction were calculated for macrophages across the age stage. (i) Representative immunofluorescence images and quantification analysis of co‐staining of IL‐1β (green) and F4/80 (red) (arrow) in kidney tissues from five young and five aged mice. Scale bars, 25 μm. DCTC, distal convoluted tubule cell; IC‐CD, intercalated cell of collecting duct. Data were represented as the mean ± SEM. *p < 0.05, **p < 0.01, and ***p < 0.001.
