FIGURE 2.

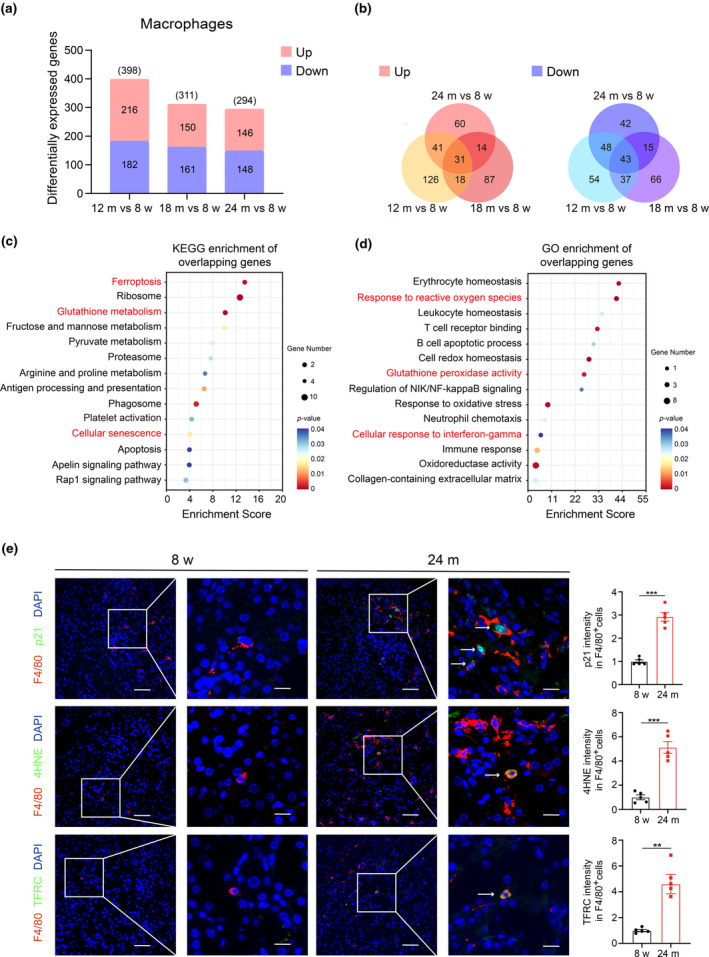
Single‐cell RNA sequencing data revealed macrophages exhibited senescence and underwent ferroptosis in renal aging. (a) DEGs of macrophages in the middle‐aged group (12 months) and aged group (18, and 24 months) compared to the young group (8 weeks). (b) Venn diagram showing the overlapped DEGs of macrophages (left: Upregulation; right: Downregulation). KEGG pathway (c) and GO pathway (d) analysis of the overlapping DEGs of macrophages. (e) Representative immunofluorescence images and quantification analysis of co‐staining of p21 (green) and F4/80 (red) (upper) (arrow), co‐staining of 4HNE (green) and F4/80 (red) (middle) (arrow), co‐staining of TFRC (green) and F4/80 (red) (lower) (arrow) in kidney tissues from five young and five aged mice. Scale bars, 50, 25 μm. DEGs, differentially expressed genes; KEGG, Kyoto Encyclopedia of Genes and Genomes; GO, Gene Ontology; 4HNE, 4‐ Hydroxynonenal; TFRC, Transferrin Receptor. Data were represented as the mean ± SEM. *p < 0.05, **p < 0.01, and ***p < 0.001.
