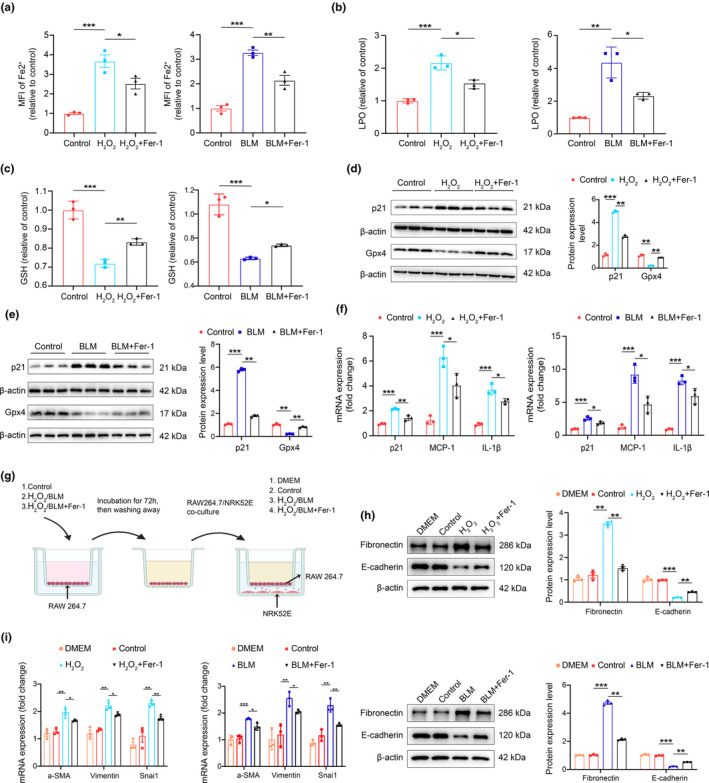
FIGURE 4.

Inhibiting ferroptosis signaling by Ferrostatin‐1 alleviated macrophage‐mediated tubular epithelial‐mesenchymal transition in vitro. Cell ferrous ion (Fe2+) level analysis (a), lipid peroxidation measurement (b), and glutathione measurement (c) in drug‐induced senescent macrophage models in vitro with or without Fer‐1. (d, e) Representative western blot and quantification of p21 and Gpx4 protein expression in drug‐induced senescent macrophage models in vitro with or without Fer‐1. (f) RT‐qPCR analysis of p21, MCP‐1, IL‐1β mRNAs in drug‐induced senescent macrophage models in vitro with or without Fer‐1. (g) Schematic diagram of co‐culture of RAW264.7 cells and NRK‐52E kidney tubular cell. (h) Representative western blot and quantification of fibronectin and e‐cadherin protein expression in co‐culture models in vitro (upper and lower). (i) RT‐qPCR analysis of α‐SMA, Vimentin, and Snai1 mRNA in drug‐induced senescent macrophage models in vitro with or without Fer‐1. Data were represented as the mean ± SEM. *p < 0.05, **p < 0.01, and ***p < 0.001.
